Data Driven Colored Text for Reporting Services Reports

In SSRS you can use data driven expressions to color code certain rows. This post will show you how to accomplish this.

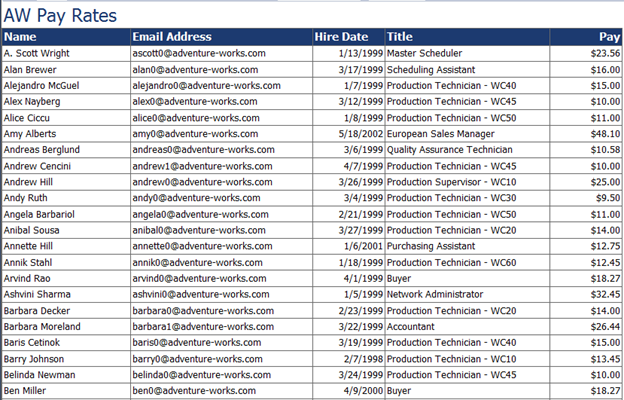
First thing is first. I’m assuming you already have a report created. In this example, I’m using the AdventureWorks database and I’m running a report on Name, Email, Hire Date, Title and Pay Rate:

SQL Freelancer SQL Server SSRS

Formatting Needs

I want to distinguish three different levels of pay. If the Employee makes $10.00 or less I would like to change the text Red. If the employee makes between $10.01 and $20.00 I would like to keep the text Black and if the employee makes more than $20.00 I would like to change the text Green.

Changing Text Color

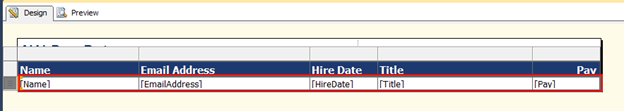
First, go to the Design tab of Designer view and select all the fields in which the color of text needs to change. In this example, I’ll select all fields.

SQL Freelancer SQL Server SSRS
Next, I’ll go to the Properties Window. If you don’t see this window you can choose View, Properties or simply hit F4.

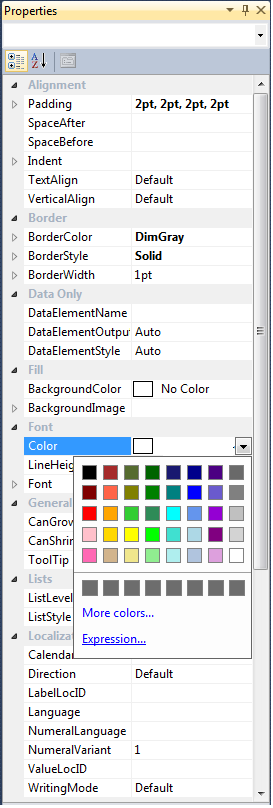
In the Properties Window click the arrow beside Color and choose Expression:

SQL Freelancer SQL Server SSRS

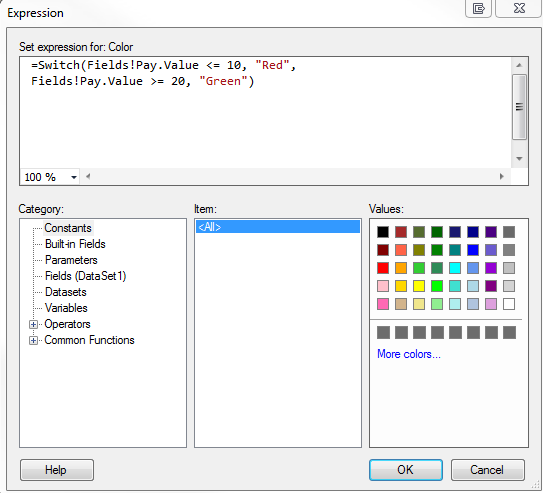
In the Expression box type your VB expression and click OK. In this example I’m using the following:

=SWITCH(Fields!Pay.Value <= 10, "Red", Fields!Pay.Value >= 20, "Green")

SQL Freelancer SQL Server SSRS
Click here to view the rest of this post.

Client Statistics

A feature often overlooked while tuning queries is Client Statistics located right on SSMS editor bar.

SQL Freelancer SQL Server Client Statistics
Other ways of opening Client Statistics include:

SHIFT + ALT + S and Menu Bar – Query -> Include Client Statistics

SQL Freelancer SQL Server Client Statistics

Client Statistics is useful when the user needs to gather information about execution times, processing times, the amount of data sent between client and server, etc. it’s very easy to use. Simply turn it on using one of the methods above and execute your query.

In this example I’m using the following query:

SELECT pc.FirstName
,pc.LastName
,pc.EmailAddress
,he.Title
,hh.Rate
FROM Person.Contact pc
JOIN HumanResources.Employee he ON pc.ContactID = he.ContactID
JOIN HumanResources.EmployeePayHistory hh ON he.EmployeeID = hh.EmployeeID
WHERE hh.Rate > 10
ORDER BY hh.Rate

After executing the query you will notice a new tab labeled Client Statistics:

SQL Freelancer SQL Server Client Statistics

After looking at the statistics provided for Trial 1 you can see the processing time = 39ms, execution time = 46ms, etc.

After the running the same query again I get the following results under Trial 2:

SQL Freelancer SQL Server Client Statistics
This time processing time went up to 45ms and execution time went up to 51ms. It also has an average column to compare overall results. The green and red arrows represent differences between trials. Green arrows indicate improved statistics and red arrows indicate degrading statistics.

A max of 10 trials can be run with the 11th trial dropping the 1st trial and so on. To reset statistics, on the menu bar, go to Query, Reset Client Statistics.

SQL Freelancer SQL Server Client StatisticsThis is great when tuning indexes because you can see different statistics as you add/delete indexes.