
Statistics IO and Statistics TIME can help in performance tuning from a granular level and saves time compared to Execution Plans, SQL Server Profiler, etc. Let’s looks at an example of these two commands:
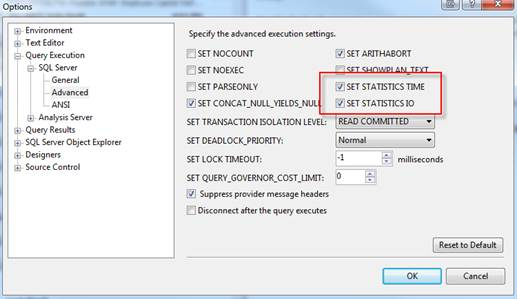
There a few different ways in which you can turn on these commands inside SQL Server Management Studio. If you want every query window to open up with statistics you can go to Tools, Options, Query Execution, SQL Server, Advanced and check SET STATISTICS TIME and SET STATISTICS IO:
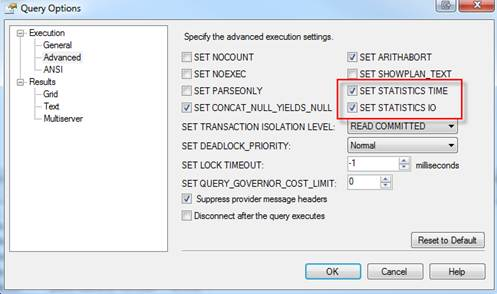
 Most of the time you will just want to use statistics for a certain troublesome query. To turn these commands on for a specified query window, open the query window and go to Query, Query Options, Execution, Advanced and check SET STATISTICS TIME and SET STATISTICS IO:
 Or you can simply use T-SQL and type the following to turn statistics on
SET STATISTICS IO ON
SET STATISTICS TIME ON
And to turn off simply use:
SET STATISTICS IO OFF
SET STATISTICS TIME OFF
In this example I’m going to run a query from AdventureWorks using statistics:
SET STATISTICS IO ON
SET STATISTICS TIME ON

SELECT pc.FirstName
,pc.LastName
,pc.EmailAddress
,he.Title
,hh.Rate
FROM Person.Contact pc
JOIN HumanResources.Employee he ON pc.ContactID = he.ContactID
JOIN HumanResources.EmployeePayHistory hh ON he.EmployeeID = hh.EmployeeID
WHERE hh.Rate > 10
ORDER BY hh.Rate
After the query finishes it will show you results like normal but if you click on the Messages tab you will see some extra information:
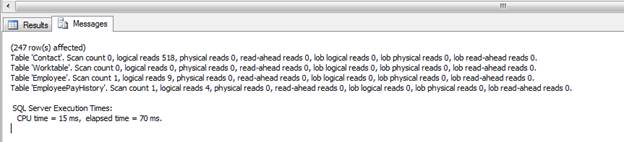
You will see IO information at the top:
Scan Count – Number of index or table scans
Logical Reads – Number of pages read from the data cache
Physical Reads – Number of pages read from disk
Read-Ahead Reads – Number of pages placed into the cache for the query
LOB Logical Reads – Number of text, ntext, image, or large value pages read from the data cache
LOB Physical Reads – Number of text, ntext, image, or large value type pages read from disk
LOB Read-Ahead Reads – Number of text, ntext, image, or large value type pages placed into the cache for the query
Execution TIME information will be directly below:
CPU Time: How long the query worked with the CPU
Elapsed Time: How long the query took to gather data
Statistics, in general, is an excellent starting point to see why you might have a poor performing query. You can gather results such as execution time, compile time, reads, writes, cost, etc.