Understanding Column Properties for a SQL Server Table

Designing a table can be a little complicated if you don’t have the correct knowledge of data types, relationships, and even column properties. In this post, I’ll go over the column properties and provide examples.

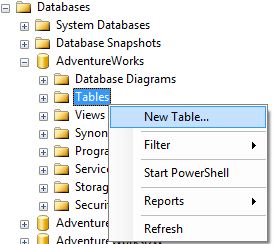
To create a new table using SSMS, expand the tree for a database and right click on Tables and select “New Table…” as shown below.

SQL Freelancer SQL Server Table Column Properties
A new window will open and once you enter a Column Name and a Data Type you will see the appropriate Column Properties for that data type as shown below:

SQL Freelancer SQL Server Table Column Properties

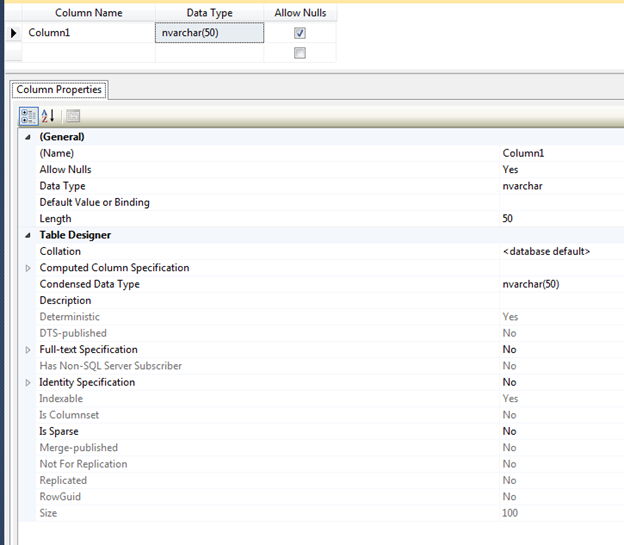
Note: Some properties only appear for certain data types

OK, let’s go over each property.


(Name)

Name, simply, is the name of the column. You can change the name of the column in the table design view or in the column properties.


Allow Nulls

Allow Nulls indicates whether or not the column will allow null values. If the column does not allow null values then some sort of data must be put into this record. You can change this value in the table design view by checking/unchecking the Allow Nulls box or from the column properties.


Data Type

Data type, like its name implies, is the type of data stored for the column. You can learn more about data types in this article. You can change the data type in the table design view or the column properties.


Default Value or Binding

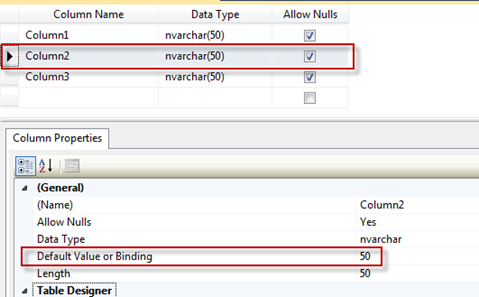
The Default Value option will allow you to enter a default value in case a value is not specified in an insert statement. For example, let’s say we have three columns in a table named Demo (Column1, Column2, and Column3) and we put a value of 50 in the Default Value or Binding for Column2.

SQL Freelancer SQL Server Table Column Properties

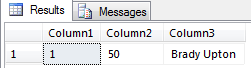
In the query below we are inserting data to Column1 and Column3, but nothing for Column2 so this will get the default value of 50.

INSERT INTO DEMO (Column1, Column3)
VALUES (1, ‘Brady Upton')

Our result set should be:

SQL Freelancer SQL Server Table Column Properties
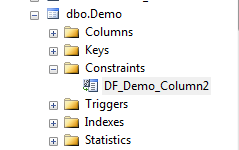
By creating a default value, this also creates a default constraint automatically as well as shown below:

SQL Freelancer SQL Server Table Column Properties


Length

Length displays the number of characters for character-based data types. For example, nvarchar(50) has a length of 50. You can change the length in table design view or column properties.


Collation

Collation can be specified at the instance level, database level, and even down to the column level. This property displays the collating sequence that SQL Server applies to the column. To change the collation using column properties, click the ellipsis and choose the collation:

SQL Freelancer SQL Server Table Column Properties

Computed Column Specification

Computed Column Specification displays information about a computed column. A computed column is a logical column that is not physically stored in the table unless the column is marked as Persisted (see Is Persisted below)

  • Formula: This field is where you can use formula’s. (See below for an example)
  • Is Persisted: This field indicates whether the results of the formula are stored in the database or are calculated each time the column is referenced

Click here to view the rest of this post.


Data Driven Colored Text for Reporting Services Reports

In SSRS you can use data driven expressions to color code certain rows. This post will show you how to accomplish this.

First thing is first. I’m assuming you already have a report created. In this example, I’m using the AdventureWorks database and I’m running a report on Name, Email, Hire Date, Title and Pay Rate:

SQL Freelancer SQL Server SSRS

Formatting Needs

I want to distinguish three different levels of pay. If the Employee makes $10.00 or less I would like to change the text Red. If the employee makes between $10.01 and $20.00 I would like to keep the text Black and if the employee makes more than $20.00 I would like to change the text Green.

Changing Text Color

First, go to the Design tab of Designer view and select all the fields in which the color of text needs to change. In this example, I’ll select all fields.

SQL Freelancer SQL Server SSRS
Next, I’ll go to the Properties Window. If you don’t see this window you can choose View, Properties or simply hit F4.

In the Properties Window click the arrow beside Color and choose Expression:

SQL Freelancer SQL Server SSRS

In the Expression box type your VB expression and click OK. In this example I’m using the following:

=SWITCH(Fields!Pay.Value <= 10, "Red", Fields!Pay.Value >= 20, "Green")

SQL Freelancer SQL Server SSRS
Click here to view the rest of this post.

Creating an SSRS Map report with data pinpoints

SQL Server Reporting Services has some cool features such as displaying maps and data points on the maps.  In this post I’ll show how to take a list of addresses and display them as pinpoints on a map in an SSRS report.

With SSRS 2008R2 you have the capability of adding maps to your reports using spatial data. In this tip I’ll show you how to accomplish this.

If you have a table with addresses, zip codes, etc. we’ll need to find the latitude and longitude of each address. You can accomplish this by using a geocoding website. There are many out there but I use http://www.gpsvisualizer.com/geocoder/ because it’s fast and easy to copy and paste multiple addresses into their input box, click “start geocoding” and within seconds it will output latitude and longitude information.

Once you get the latitude and longitude information you can import it into your database. See below for an example of my table of Alabama cities and zip codes with their appropriate coordinates.

SQL Freelancer SQL Server SSRS Maps

Once you have your coordinates we will need to create a new column with a geography data type that we will add our spatial data into. The following code will accomplish this.

ALTER TABLE ZipCodes ADD SpatialData geography

We should now have a table that looks like below:

SQL Freelancer SQL Server SSRS Maps

Inserting the data into the SpatialData column can be time consuming if you have a lot of records. The best way I have figured out how to do this is to use a basic UPDATE statement. Below is my script I have created for my table for this example.

UPDATE ZipCodes SET SpatialData = 'POINT(85.972173  31.809675)' WHERE ZipCode = 36081 
UPDATE ZipCodes SET SpatialData = 'POINT(88.053241  30.686394)' WHERE ZipCode = 36685
UPDATE ZipCodes SET SpatialData = 'POINT(86.602739  33.621385)' WHERE ZipCode = 35173
UPDATE ZipCodes SET SpatialData = 'POINT(86.265837  32.35351)' WHERE ZipCode = 36106 
UPDATE ZipCodes SET SpatialData = 'POINT(87.022234  32.41179)' WHERE ZipCode = 36701 
UPDATE ZipCodes SET SpatialData = 'POINT(86.102689  33.43451)' WHERE ZipCode = 35161 
UPDATE ZipCodes SET SpatialData = 'POINT(87.571005  33.209003)' WHERE ZipCode = 35402 
UPDATE ZipCodes SET SpatialData = 'POINT(86.584979  34.729135)' WHERE ZipCode = 35801 
UPDATE ZipCodes SET SpatialData = 'POINT(86.007172  34.014772)' WHERE ZipCode = 35901 
UPDATE ZipCodes SET SpatialData = 'POINT(86.809484  33.517467)' WHERE ZipCode = 35266 
UPDATE ZipCodes SET SpatialData = 'POINT(86.300629  32.38012)' WHERE ZipCode = 36124 
UPDATE ZipCodes SET SpatialData = 'POINT(86.977029  34.60946)' WHERE ZipCode = 35602 
UPDATE ZipCodes SET SpatialData = 'POINT(85.239689  31.941565)' WHERE ZipCode = 36072

Once you update your table with the spatial data and run SELECT * FROM ZipCodes you should see the following output:

SQL Freelancer SQL Server SSRS Maps
Click here to view the rest of this post.