Collect SQL Server Performance Counters and Build Reports with SSRS

Third party tools are awesome for capturing performance metrics, but some small shops (and even large shops) don’t budget for this type of software leaving it up to the DBA to create their own monitoring solution.

There are a few different ways to capture certain performance metrics, but in this post I’ll focus on using the sys.dm_os_performance_counters DMV and how to view this data in a more readable form using SQL Server Reporting Services graphs. The DMV doesn’t include all the counters as Performance Monitor, but it does show the SQL Server related counters. (Note that some of the counters in this DMV are of cumulative values since the last reboot.)

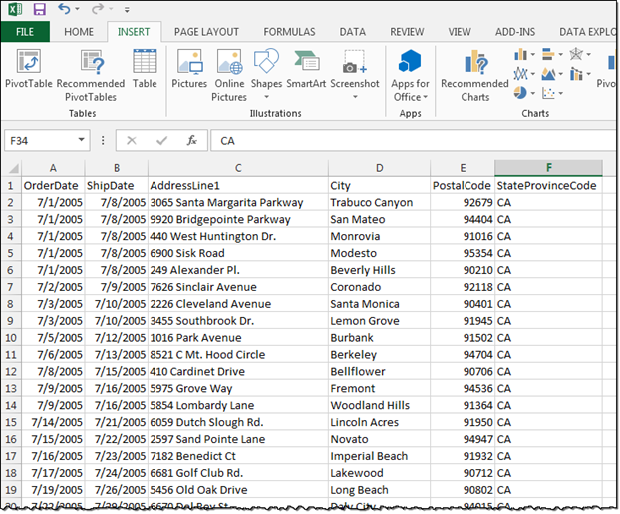
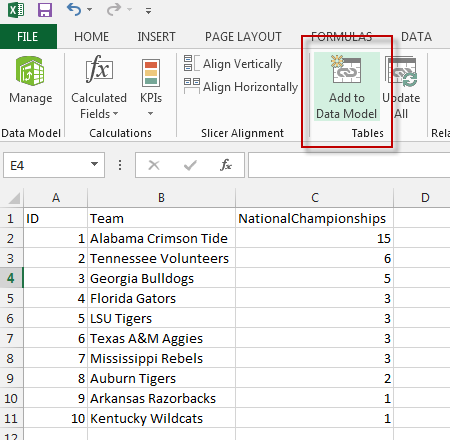
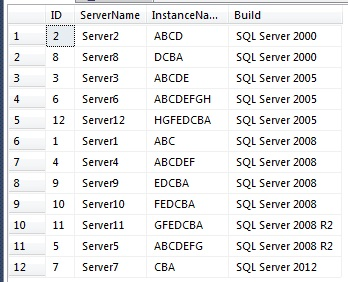
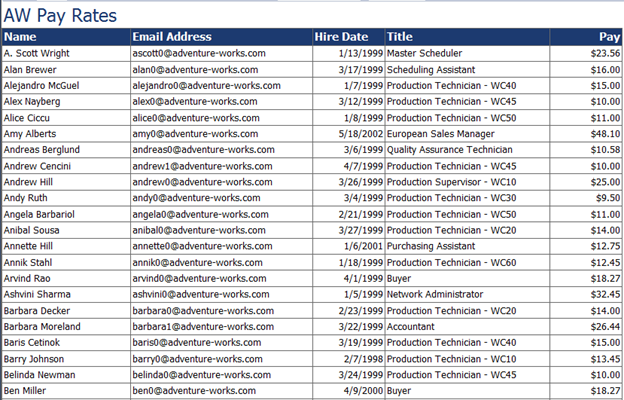
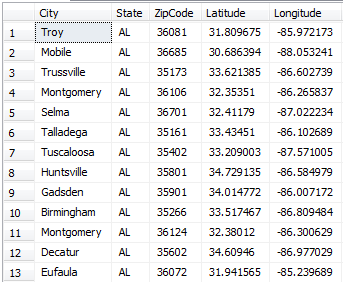
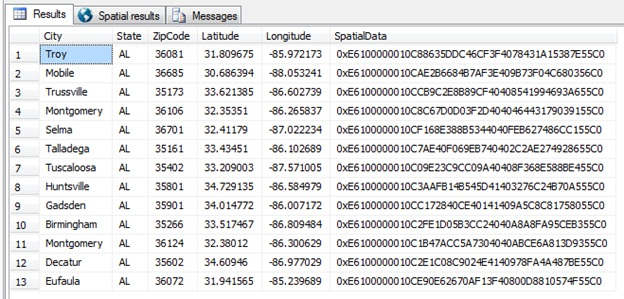
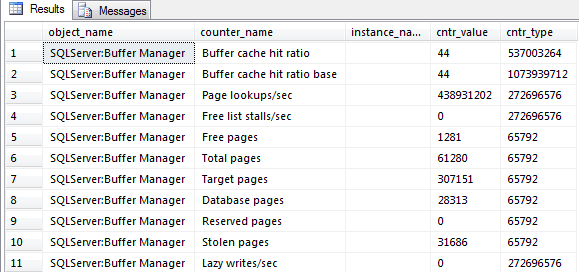
You can query this DMV using the following query:

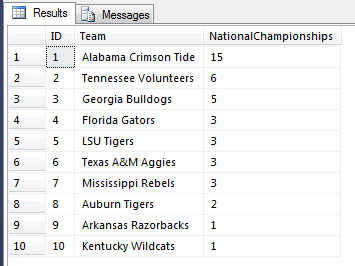
SELECT * FROM sys.dm_os_performance_counters

SQL Freelancer SQL Server Performance Counters SSRS

As you can see from the screenshot above, this can be hard to read. Also, it only shows the current values at the time the query is executed so you don’t know anything about the past and it makes it hard to see how the data fluctuates during the business day.

Collecting the SQL Server Monitoring Report Data

For the purpose of simplicity, this tip will focus on one counter, Page Life Expectancy (PLE). I’ll show you how to capture data and create a graph for analysis.

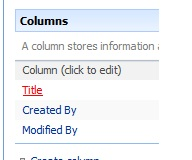
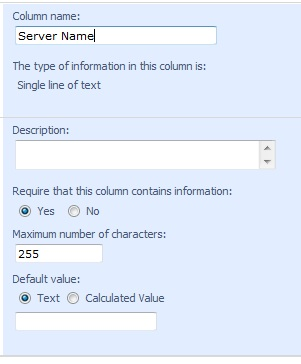
First, we’ll need to create a table that will store our metrics:

CREATE TABLE [dbo].[CounterCollections](
[ID] [int] IDENTITY(1,1) NOT NULL,
[object_name] [varchar](128) NOT NULL,
[counter_name] [varchar](128) NOT NULL,
[cntr_value] [bigint] NOT NULL,
[collection_datetime] [datetime] NOT NULL )

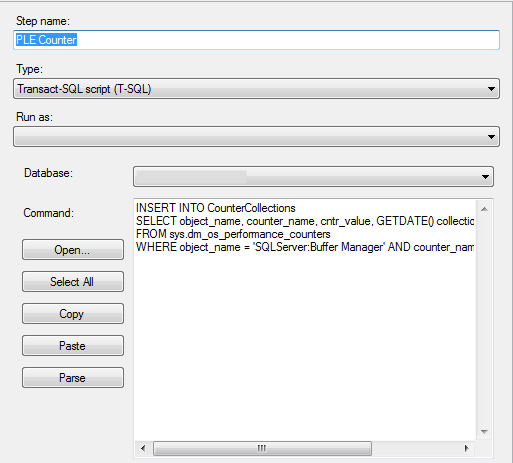
Next, we’ll need to create a script that will insert our data into the table we created above:

INSERT INTO CounterCollections
SELECT object_name, counter_name, cntr_value, GETDATE() collection_datetime
FROM sys.dm_os_performance_counters
WHERE object_name = ‘SQLServer:Buffer Manager’
AND counter_name = ‘Page life expectancy’

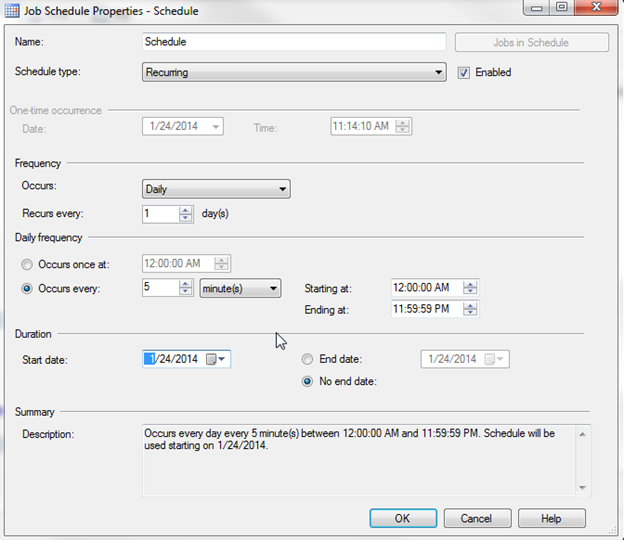
Finally, we’ll need to create a SQL Server Agent Job that will run the script above on a specified schedule:

SQL Freelancer SQL Server Performance Counters SSRS
I’ll run this job every 5 minutes:

SQL Freelancer SQL Server Performance Counters SSRS

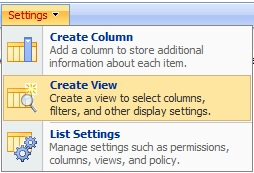
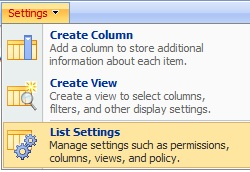
Creating the SQL Server Monitoring Report

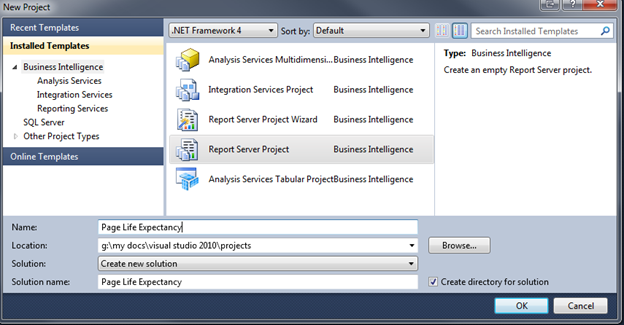
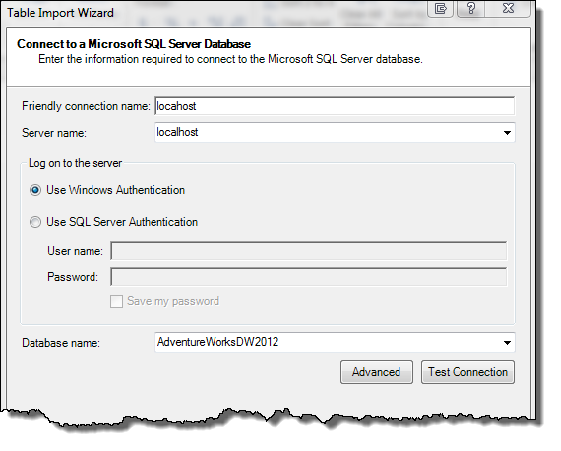
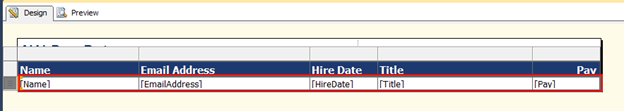
While the table gathers data we can switch over to Business Intelligence Development Studio (BIDS) or the SQL Server Data Tools (SSDT) and create a SSRS Report that will display our data.

In this example, I’m using SSDT. Choose File, New Project. On the New Project dialog choose Report Server Project and name the Project:

SQL Freelancer SQL Server Performance Counters SSRS
Click here to view the rest of this post.

Power Query for Excel

In this post, I’ll discuss the prerequisites and how to install and enable Power Query (Data Explorer) and I’ll show you how to use this new feature.

Prerequisites:

  • Requires Microsoft Office 2010 SP1 or Microsoft Excel 2013 32-bit or 64-bit
  • Requires Windows Vista (with .Net 3.5 SP1 or greater), Windows Server 2008 (with .Net 3.5 SP1 or greater), Windows Server 2008 R2, Windows 7 or Windows 8.

Installation:

Download and install the preview from Microsoft Download Center

Once the feature is installed open Excel and go to File, Options, Add-Ins. Select COM Add-Ins and click Go.

SQL Freelancer SQL Server Excel Data Explorer Power Query BI
Check Microsoft “Data Explorer” Preview for Excel and click OK.
SQL Freelancer SQL Server Excel Data Explorer Power Query BI
Once Data Explorer has been enabled, the tab will appear above the Office ribbon.

SQL Freelancer SQL Server Excel Data Explorer Power Query BI

Now that we have Data Explorer installed and enabled we can get to the fun stuff.

To see a detailed list of each element you can visit Microsoft Data Explorer Help

If you click on the Data Explorer tab you will notice Get External Data. Just like Excel and PowerPivot, this is where our data source will come from. There are multiple data sources to choose from including websites, files, databases, Active Directory, and even Facebook. Yes….Facebook.

SQL Freelancer SQL Server Excel Data Explorer Power Query BI

In this tip, I’ll show you examples of two data sources. We’ll pull data from a website and create a map report using PowerView and we’ll pull data from Facebook and make a report using PowerPivot.

Web Data Source

In the first example, I’ll pull table data from the web using Wikipedia. Choose “From Web” from the Get External Data section and use the following URL:http://en.wikipedia.org/wiki/List_of_countries_by_population

SQL Freelancer SQL Server Excel Data Explorer Power Query BI

Click OK

In the Query Editor under Navigator, select Countries. This will display rank, country, population, date, % of world population and source. We can filter columns just like in Excel by selecting the header arrow and choosing the appropriate filter. In this example, we’ll filter Source to only includes records that are an official estimate.

SQL Freelancer SQL Server Excel Data Explorer Power Query BI
Click here to view the rest of this post.

Microsoft’s new 3D data visualization BI product – Power Map

Microsoft has introduced a new BI product that will provide 3D data visualization using Bing Maps. This product is still in beta and is codenamed “GeoFlow” but should be out late 2013 or early 2014. This preview will allow you to plot geographic and temporal data visually, analyze that data in 3D, and create visual tours. It is a really cool product and I can’t wait to use it in a business atmosphere.

In this post, I’ll discuss the prerequisites and how to install “GeoFlow” and I’ll give an introduction on how to use this feature.

Prerequisites:

  • Requires Microsoft Office Professional Plus 2013 or Office 365 ProPlus
  • Supports 32-bit or 64-bit machines
  • Requires Windows 7, Windows 8, or Windows Server 2008R2 (requires .NET Framework 4.0)
  • Requires internet access

Installation

Download and install the preview from Microsoft Download Center (make sure Excel is closed while installing)

Open Excel and “Maps” will appear as a new item in the “Insert” tab of the Excel ribbon:

SQL Freelancer SQL Server Excel GeoFlow Power Map BI
Now that “GeoFlow is installed, we can begin using the new feature.

For this tip, I’m using the AdventureWorks2012 database and the result set from the following query imported into Excel:

  SELECT  
  OrderDate, 
  ShipDate, 
  AddressLine1, 
  City, 
  PostalCode, 
  StateProvinceCode
  FROM [AdventureWorks2012].[Sales].[SalesOrderHeader] soh
  JOIN [AdventureWorks2012].[Person].[Address] ps ON soh.ShipToAddressID = ps.AddressID
  JOIN [AdventureWorks2012].[Person].[StateProvince] psp ON psp.StateProvinceID = ps.StateProvinceID
  WHERE StateProvinceCode = 'CA'

SQL Freelancer SQL Server Excel GeoFlow Power Map BI
Once you have the data in Excel, click on the “Insert” tab on the Office ribbon and click Map. You should now see the “GeoFlow” globe:

SQL Freelancer SQL Server Excel GeoFlow Power Map BI
There are a few tabs you can use right away in the ribbon bar. Under the “Map” item you can change Themes and add Map Labels. I like to enable the Map labels so I can see a more detailed version of the map. You can also zoom in and out and move the map using the arrows and +/- buttons in the bottom right corner of the map.SQL Freelancer SQL Server Excel GeoFlow Power Map BI
On the right side you see the “Layer” pane. This is where you will choose your geography visualizations. For this example Ill select “PostalCode” under the range section and since we know that this column stores zip codes we’ll map it to “Zip” under the Geography section:

SQL Freelancer SQL Server Excel GeoFlow Power Map BI

Once the fields are selected, click Map It.

You might notice that 86 records were updated meaning that there are 86 unique zip codes in California and it placed a marker on each zip code:

SQL Freelancer SQL Server Excel GeoFlow Power Map BI
Click here to view the rest of this post.

Building Key Performance Indicators (KPIs) with PowerPivot

A KPI (Key Performance Indicator) is a graphical representation that displays progress against a predefined measure or business goal. KPIs make it easier for end users to evaluate the amount of progress without reading a bunch of data.

In this post, I’ll use AdventureWorksDW2012 sample data so you can follow along with me. The database can be downloaded here.

Let’s get started.

Enabling PowerPivot in Excel 2013

To enable PowerPivot, open Excel, go to File, Options, Add-Ins, select COM Add-ins and click Go. This will open up the COM Add-Ins dialog box. Click “Microsoft Office PowerPivot for Excel 2013” and hit OK. After successfully enabling PowerPivot, the tab should appear at the top of the Excel spreadsheet:

SQL Freelancer SQL Server PowerPivot KPI

Importing Data

Open Excel, click the PowerPivot tab, Manage:

SQL Freelancer SQL Server PowerPivot KPI
Upon clicking Manage, a new window should appear. From this window, you will import data. Click From Database and select From SQL Server:

SQL Freelancer SQL Server PowerPivot KPI
Type in the Server Name, Authentication mode, and browse to the AdventureWorksDW2012 database:
SQL Freelancer SQL Server PowerPivot KPIClick Next, choose “Select from a list of tables and views to choose the data to import” and click Next. The next screen is where we will select our data to import. For this example, choose FactInternetSales and click “Select Related Tables”. The Select Related Tables button enables you to automatically select every table that is related to the source table selected:

SQL Freelancer SQL Server PowerPivot KPI
After clicking Finish, the import will begin. Once the import finishes successfully you should be able to view all the tables separated into sheets:

SQL Freelancer SQL Server PowerPivot KPI

Creating PivotTable

Before creating a KPI we will need to slice and dice our data into a PivotTable. To do this, click PivotTable on the ribbon bar and choose New Worksheet:

SQL Freelancer SQL Server PowerPivot KPI
Click here to view the rest of this post.

PowerPivot with Excel 2013

Excel 2013 changes things up a bit when it comes to installing PowerPivot. In previous versions you had to download the component and install, but with Excel 2013 it comes installed as an add-in, but disabled by default. To enable PowerPivot, open Excel, go to File, Options, Add-Ins, select COM Add-ins and click Go.

SQL Freelancer SQL Server Excel PowerPivot
This will open up the COM Add-Ins dialog box. Click “Microsoft Office PowerPivot for Excel 2013” and hit OK.

SQL Freelancer SQL Server Excel PowerPivot
After successfully enabling PowerPivot, the tab should appear at the top of the Excel spreadsheet.

SQL Freelancer SQL Server Excel PowerPivot

Creating a dashboard

There are a few different ways in which to import data into Excel to use with PowerPivot. Some of these ways include:

  • From database

SQL Freelancer SQL Server Excel PowerPivot

  • From Data Service

SQL Freelancer SQL Server Excel PowerPivot

  • From other sources such as Oracle, Excel, flat files, etc.

For this example, and simplicity sake, I will just run a query and simply copy and paste my results into the Excel spreadsheet. The query results look like this:

SQL Freelancer SQL Server Excel PowerPivot
Once the results are copied and pasted into Excel, click the PowerPivot tab and click Add to Data Model:

SQL Freelancer SQL Server Excel PowerPivot
On the create table dialog box, make sure you select the range for your data and click “My table has headers”

SQL Freelancer SQL Server Excel PowerPivot
After clicking OK, the PowerPivot window should appear. To start creating the dashboard, click PivotTable, PivotChart, then select New Worksheet:

SQL Freelancer SQL Server Excel PowerPivot
Click here to view the rest of this post.

Creating a SharePoint Key Performance Indicator (KPI)

A KPI (Key Performance Indicator) is a graphical representation that displays progress against a predefined measure or business goal. KPIs make it easier for end users to evaluate the amount of progress without reading a bunch of data.

We will use the sample data (see below) I used in the previous post to create our KPI (this data is static since we imported it into Sharepoint as a separate list, so it will not report real time data)

Let’s say, for example, our DBA Manager wants to upgrade all the SQL Servers to at least SQL Server 2008 R2 and wants to know how many SQL Servers are not compliant. This is a good scenario for using a KPI to display this data.

SQL Freelancer SQL Server Sharepoint KPI


Creating the KPI

In Sharepoint, browse to the page where you want the KPI displayed and go to Site Actions > Create:

SQL Freelancer SQL Server Sharepoint KPI
Custom Lists > KPI List:

SQL Freelancer SQL Server Sharepoint KPI
For this example, I’ll create a list called SQL Versions KPI:
SQL Freelancer SQL Server Sharepoint KPI
Once, the KPI list is created you should see a blank list. To add a KPI, click New > Indicator using data in Sharepoint list (you can also use other data sources for KPI’s):

SQL Freelancer SQL Server Sharepoint KPI
First, give the KPI a name:

SQL Freelancer SQL Server Sharepoint KPI
Click here to view the rest of this post.

Using SSIS to Automatically Populate a SharePoint List

In my opinion, the best (and easiest) way to accomplish this goal is using SSIS packages and a component from Codeplex called Sharepoint List Source and Destination. Ray Barley wrote a tip regarding this component a while back and he explained how to extract data from Sharepoint. I encourage everyone to check out his tip as it explains how to install the component and has some very good tips regarding the Sharepoint Source task. In this post, we’ll go over the Destination task in more detail.

Setup a Sharepoint List

For this tip, I’m just going to set up a quick custom list. This example is done in Sharepoint 2007, but Sharepoint 2010 should be close to the same.

Go to Site Actions, Create:

SQL Freelancer SQL Server Sharepoint Populate List
Custom Lists, Custom List:

SQL Freelancer SQL Server Sharepoint Populate List
For this example, I’ll create a list called SQL Versions:
SQL Freelancer SQL Server Sharepoint Populate List
Once I have a list created, I need to create a view with custom columns that match my SQL query. For this example I need Server Name, Instance Name, and Build. To create a view click Settings, Create View:

SQL Freelancer SQL Server Sharepoint Populate List
Choose Standard View:

SQL Freelancer SQL Server Sharepoint Populate List
Name the View (for this example, I’ll name it SQLVersionView and make it my default view):
SQL Freelancer SQL Server Sharepoint Populate List
Next we’ll need to create custom columns. Go to Settings, List Settings:

SQL Freelancer SQL Server Sharepoint Populate List
To create the first column click Title and rename it to Server Name:

SQL Freelancer SQL Server Sharepoint Populate ListSQL Freelancer SQL Server Sharepoint Populate List
Click here to view the rest of this post.

Data Driven Colored Text for Reporting Services Reports

In SSRS you can use data driven expressions to color code certain rows. This post will show you how to accomplish this.

First thing is first. I’m assuming you already have a report created. In this example, I’m using the AdventureWorks database and I’m running a report on Name, Email, Hire Date, Title and Pay Rate:

SQL Freelancer SQL Server SSRS

Formatting Needs

I want to distinguish three different levels of pay. If the Employee makes $10.00 or less I would like to change the text Red. If the employee makes between $10.01 and $20.00 I would like to keep the text Black and if the employee makes more than $20.00 I would like to change the text Green.

Changing Text Color

First, go to the Design tab of Designer view and select all the fields in which the color of text needs to change. In this example, I’ll select all fields.

SQL Freelancer SQL Server SSRS
Next, I’ll go to the Properties Window. If you don’t see this window you can choose View, Properties or simply hit F4.

In the Properties Window click the arrow beside Color and choose Expression:

SQL Freelancer SQL Server SSRS

In the Expression box type your VB expression and click OK. In this example I’m using the following:

=SWITCH(Fields!Pay.Value <= 10, "Red", Fields!Pay.Value >= 20, "Green")

SQL Freelancer SQL Server SSRS
Click here to view the rest of this post.

Creating an SSRS Map report with data pinpoints

SQL Server Reporting Services has some cool features such as displaying maps and data points on the maps.  In this post I’ll show how to take a list of addresses and display them as pinpoints on a map in an SSRS report.

With SSRS 2008R2 you have the capability of adding maps to your reports using spatial data. In this tip I’ll show you how to accomplish this.

If you have a table with addresses, zip codes, etc. we’ll need to find the latitude and longitude of each address. You can accomplish this by using a geocoding website. There are many out there but I use http://www.gpsvisualizer.com/geocoder/ because it’s fast and easy to copy and paste multiple addresses into their input box, click “start geocoding” and within seconds it will output latitude and longitude information.

Once you get the latitude and longitude information you can import it into your database. See below for an example of my table of Alabama cities and zip codes with their appropriate coordinates.

SQL Freelancer SQL Server SSRS Maps

Once you have your coordinates we will need to create a new column with a geography data type that we will add our spatial data into. The following code will accomplish this.

ALTER TABLE ZipCodes ADD SpatialData geography

We should now have a table that looks like below:

SQL Freelancer SQL Server SSRS Maps

Inserting the data into the SpatialData column can be time consuming if you have a lot of records. The best way I have figured out how to do this is to use a basic UPDATE statement. Below is my script I have created for my table for this example.

UPDATE ZipCodes SET SpatialData = 'POINT(85.972173  31.809675)' WHERE ZipCode = 36081 
UPDATE ZipCodes SET SpatialData = 'POINT(88.053241  30.686394)' WHERE ZipCode = 36685
UPDATE ZipCodes SET SpatialData = 'POINT(86.602739  33.621385)' WHERE ZipCode = 35173
UPDATE ZipCodes SET SpatialData = 'POINT(86.265837  32.35351)' WHERE ZipCode = 36106 
UPDATE ZipCodes SET SpatialData = 'POINT(87.022234  32.41179)' WHERE ZipCode = 36701 
UPDATE ZipCodes SET SpatialData = 'POINT(86.102689  33.43451)' WHERE ZipCode = 35161 
UPDATE ZipCodes SET SpatialData = 'POINT(87.571005  33.209003)' WHERE ZipCode = 35402 
UPDATE ZipCodes SET SpatialData = 'POINT(86.584979  34.729135)' WHERE ZipCode = 35801 
UPDATE ZipCodes SET SpatialData = 'POINT(86.007172  34.014772)' WHERE ZipCode = 35901 
UPDATE ZipCodes SET SpatialData = 'POINT(86.809484  33.517467)' WHERE ZipCode = 35266 
UPDATE ZipCodes SET SpatialData = 'POINT(86.300629  32.38012)' WHERE ZipCode = 36124 
UPDATE ZipCodes SET SpatialData = 'POINT(86.977029  34.60946)' WHERE ZipCode = 35602 
UPDATE ZipCodes SET SpatialData = 'POINT(85.239689  31.941565)' WHERE ZipCode = 36072

Once you update your table with the spatial data and run SELECT * FROM ZipCodes you should see the following output:

SQL Freelancer SQL Server SSRS Maps
Click here to view the rest of this post.