SQL Server Performance Dashboard Reports

SQL Server 2012 Performance Dashboard Reports is one of most popular SQL Server monitoring solution for customers and SQL community leveraging dynamic management views (DMVs) for monitoring and reporting and available at no cost to consumers. SQL Server Performance Dashboard Reports are available as a set of custom reports in SQL Server Management Studio (SSMS) which runs against the connected instance in Object Explorer. When monitoring large enterprise deployments of SQL Server, hosting SQL Server Performance Dashboard Reports on a central reporting server can provide additional benefits making life easier for enterprise DBAs for monitoring and troubleshooting SQL Server issues. To support hosting SQL performance dashboard reports on a central SQL Server Reporting Services instance, we have customized SQL Server 2012 Performance Dashboard Reports, added new reports and uploaded in Tiger toobox github repository for customers and SQL community. The reports are tested to run against SQL Server 2012, SQL Server 2014 and SQL Server 2016 versions of target SQL Server instance and can be deployed against SQL Server 2012, SQL Server 2014 or SQL Server 2016 Reporting Services instance.

Following are some of the benefits of hosting SQL Performance dashboard reports on central SSRS reporting server.

  • Monitoring Reports accessible anytime, anywhere using browser – This removes the dependency of thick client like SQL Server Management Studio (SSMS) to be present on the workstation server allowing DBAs, DevOps audience to check the health of SQL Server and resource consumption using web browser from any workstation machine with access to the server.
  • Scheduling automatic report delivery – SSRS allows scheduled email or file share delivery of reports. This allows DBAs, application owners and database stakeholders to choose push model where by performance health reports can be scheduled to run against specified SQL Server instances at the specified time and be delivered in their mailbox to proactively monitor overall health of SQL Server instance and detect any anomaly.
  • Performance Base lining using Report Snapshots – SSRS allows you to capture scheduled point in time report snapshots at the specified time interval allowing DBAs to establish performance baselines using historical snapshots for the target SQL Server instances.
  • Linked Reports for Application owners and other stakeholders – In an enterprise environment, most application teams and stakeholders are interested to see the performance, resource consumption, blocking information and overall health of their SQL Server instance on-demand. In such scenarios, DBAs can create linked reports for the target SQL Server instances on the SSRS central server and delegate them permissions to view reports for their target SQL Server instance of interest. This allows application teams, developers to be self-sufficient to check the overall health of their SQL Server instances creating some bandwidth for DBAs who needs to be contacted only if there is an anomaly or problem detected.

Click here to view the rest of this post.

Collect SQL Server Performance Counters and Build Reports with SSRS

Third party tools are awesome for capturing performance metrics, but some small shops (and even large shops) don’t budget for this type of software leaving it up to the DBA to create their own monitoring solution.

There are a few different ways to capture certain performance metrics, but in this post I’ll focus on using the sys.dm_os_performance_counters DMV and how to view this data in a more readable form using SQL Server Reporting Services graphs. The DMV doesn’t include all the counters as Performance Monitor, but it does show the SQL Server related counters. (Note that some of the counters in this DMV are of cumulative values since the last reboot.)

You can query this DMV using the following query:

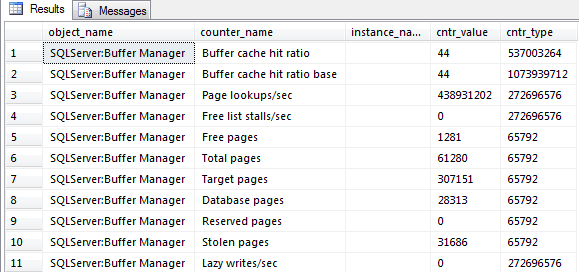
SELECT * FROM sys.dm_os_performance_counters

SQL Freelancer SQL Server Performance Counters SSRS

As you can see from the screenshot above, this can be hard to read. Also, it only shows the current values at the time the query is executed so you don’t know anything about the past and it makes it hard to see how the data fluctuates during the business day.

Collecting the SQL Server Monitoring Report Data

For the purpose of simplicity, this tip will focus on one counter, Page Life Expectancy (PLE). I’ll show you how to capture data and create a graph for analysis.

First, we’ll need to create a table that will store our metrics:

CREATE TABLE [dbo].[CounterCollections](
[ID] [int] IDENTITY(1,1) NOT NULL,
[object_name] [varchar](128) NOT NULL,
[counter_name] [varchar](128) NOT NULL,
[cntr_value] [bigint] NOT NULL,
[collection_datetime] [datetime] NOT NULL )

Next, we’ll need to create a script that will insert our data into the table we created above:

INSERT INTO CounterCollections
SELECT object_name, counter_name, cntr_value, GETDATE() collection_datetime
FROM sys.dm_os_performance_counters
WHERE object_name = ‘SQLServer:Buffer Manager’
AND counter_name = ‘Page life expectancy’

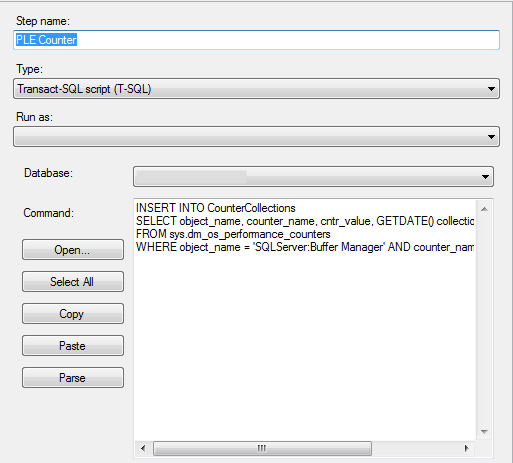
Finally, we’ll need to create a SQL Server Agent Job that will run the script above on a specified schedule:

SQL Freelancer SQL Server Performance Counters SSRS
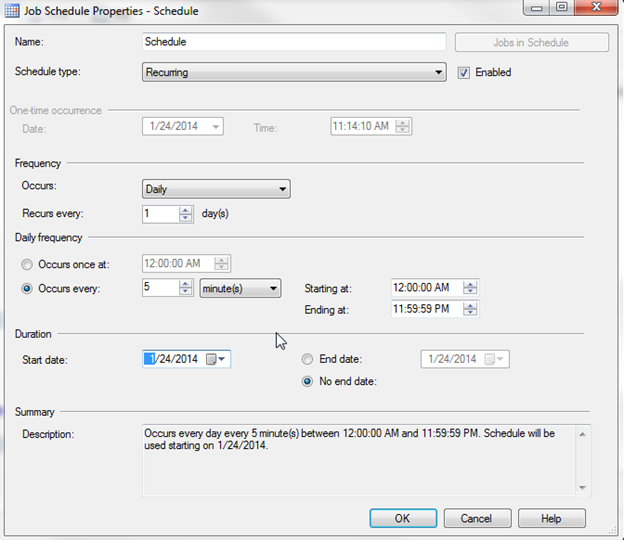
I’ll run this job every 5 minutes:

SQL Freelancer SQL Server Performance Counters SSRS

Creating the SQL Server Monitoring Report

While the table gathers data we can switch over to Business Intelligence Development Studio (BIDS) or the SQL Server Data Tools (SSDT) and create a SSRS Report that will display our data.

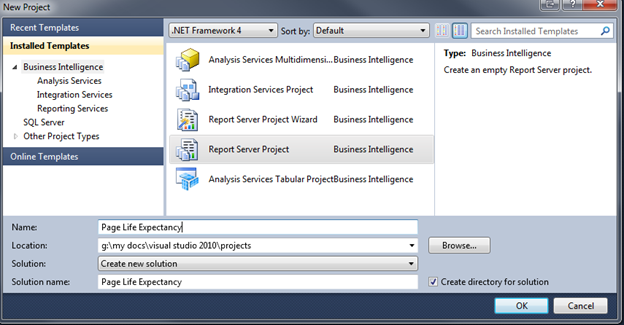
In this example, I’m using SSDT. Choose File, New Project. On the New Project dialog choose Report Server Project and name the Project:

SQL Freelancer SQL Server Performance Counters SSRS
Click here to view the rest of this post.

Report to Capture Table Growth Statistics for SQL Server

There are a few tools that monitor table size growth, but with the use of sp_spaceused and SQL Server Reporting Services (SSRS) you can make custom reports.

Using sp_spaceused

The system stored procedure sp_spaceused displays the number of rows, disk space reserved, and disk space used by a table, indexed view, or Service Broker queue in the current database in an object is provided or it displays the disk space reserved and used by the whole database.

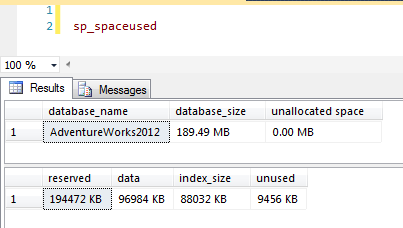
This procedure, sp_spaceused can be used at the database or table level. For example, sp_spaceused at the database level returns the following:

SQL Freelancer SQL Server SSRS Table Growth
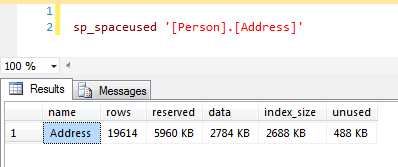
And sp_spaceused at the table level displays:
SQL Freelancer SQL Server SSRS Table Growth


Creating the Report

To create our custom report, first we will need to create a table that will store the data from sp_spaceused. For this example, I’ll create a table named TableSizeGrowth.

CREATE TABLE [dbo].[TableSizeGrowth](
[id] [int] IDENTITY(1,1) NOT NULL,
[table_schema] [nvarchar](256) NULL,
[table_name] [nvarchar](256) NULL,
[table_rows] [int] NULL,
[reserved_space] [int] NULL,
[data_space] [int] NULL,
[index_space] [int] NULL,
[unused_space] [int] NULL,
[date] [datetime] NULL
) ON [PRIMARY]

I’m also going to add a default constraint that will automatically update the date column to the current date for each new row.

ALTER TABLE [dbo].[TableSizeGrowth] ADD CONSTRAINT [DF_TableSizeGrowth_date]  
DEFAULT (dateadd(day,(0),datediff(day,(0),getdate()))) FOR [date]
GO

Next, we need to create a stored procedure that moves the data from sp_spaceused to the table we created above. I have put comments throughout the stored procedure to help you figure out what is going on. Also make sure you change the table names to match your tables. For this example, I want to monitor HumanResources.Employee, Production.Product, and Purchasing.Vendor tables.

SET ANSI_NULLS ON
GO
SET QUOTED_IDENTIFIER ON
GO
CREATE PROCEDURE [dbo].[sp_TableSizeGrowth] 
AS
BEGIN
 SET NOCOUNT ON

 --DECLARE VARIABLES
 DECLARE
 @max INT,
 @min INT,
 @table_name NVARCHAR(256),
 @table_schema NVARCHAR(256),
 @sql NVARCHAR(4000)

 --DECLARE TABLE VARIABLE
 DECLARE @table TABLE(
 id INT IDENTITY(1,1) PRIMARY KEY,
 table_name NVARCHAR(256),
 table_schema NVARCHAR(256))

 --CREATE TEMP TABLE THAT STORES INFORMATION FROM SP_SPACEUSED
 IF (SELECT OBJECT_ID('tempdb..#results')) IS NOT NULL
 BEGIN
  DROP TABLE #results
 END

 CREATE TABLE #results
 (
  [table_schema] [nvarchar](256) NULL,
  [table_name] [nvarchar](256) NULL,
  [table_rows] [int] NULL,
  [reserved_space] [nvarchar](55) NULL,
  [data_space] [nvarchar](55) NULL,
  [index_space] [nvarchar](55) NULL,
  [unused_space] [nvarchar](55) NULL
 )

 --LOOP THROUGH STATISTICS FOR EACH TABLE
 INSERT @table(table_schema, table_name)
 SELECT  
  table_schema, table_name
 FROM
  information_schema.tables 
 WHERE table_schema + '.' + table_name IN ('HumanResources.Employee','Production.Product', 'Purchasing.Vendor') --INSERT TABLE NAMES TO MONITOR

 SELECT
  @min = 1,
  @max = (SELECT MAX(id) FROM @table)

 WHILE @min = @max
 BEGIN
  SELECT 
   @table_name = table_name,
   @table_schema = table_schema
  FROM
   @table
  WHERE
   id = @min

  --DYNAMIC SQL
  SELECT @sql = 'EXEC sp_spaceused ''[' + @table_schema + '].[' + @table_name + ']'''

  --INSERT RESULTS FROM SP_SPACEUSED TO TEMP TABLE
  INSERT #results(table_name, table_rows, reserved_space, data_space, index_space, unused_space)
  EXEC (@sql)

  --UPDATE SCHEMA NAME
  UPDATE #results
  SET table_schema = @table_schema
  WHERE table_name = @table_name
  SELECT @min = @min + 1
 END

 --REMOVE "KB" FROM RESULTS FOR REPORTING (GRAPH) PURPOSES
 UPDATE #results SET data_space = SUBSTRING(data_space, 1, (LEN(data_space)-3))
 UPDATE #results SET reserved_space = SUBSTRING(reserved_space, 1, (LEN(reserved_space)-3))
 UPDATE #results SET index_space = SUBSTRING(index_space, 1, (LEN(index_space)-3))
 UPDATE #results SET unused_space = SUBSTRING(unused_space, 1, (LEN(unused_space)-3))

 --INSERT RESULTS INTO TABLESIZEGROWTH
 INSERT INTO TableSizeGrowth (table_schema, table_name, table_rows, reserved_space, data_space, index_space, unused_space)
 SELECT * FROM #results

 DROP TABLE #results
END

Now that the stored procedure has been created, let’s go ahead and execute it.

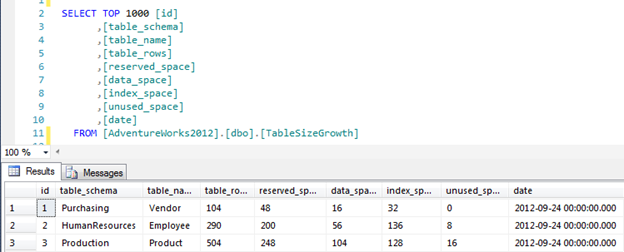
Once the stored procedure finishes we can view the table:

SQL Freelancer SQL Server SSRS Table Growth
Click here to view the rest of this post.

Data Driven Colored Text for Reporting Services Reports

In SSRS you can use data driven expressions to color code certain rows. This post will show you how to accomplish this.

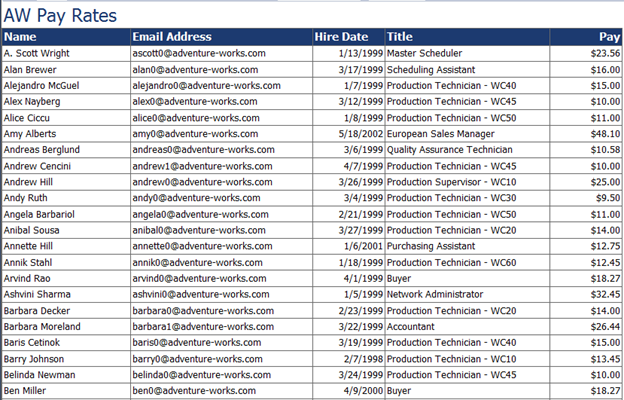
First thing is first. I’m assuming you already have a report created. In this example, I’m using the AdventureWorks database and I’m running a report on Name, Email, Hire Date, Title and Pay Rate:

SQL Freelancer SQL Server SSRS

Formatting Needs

I want to distinguish three different levels of pay. If the Employee makes $10.00 or less I would like to change the text Red. If the employee makes between $10.01 and $20.00 I would like to keep the text Black and if the employee makes more than $20.00 I would like to change the text Green.

Changing Text Color

First, go to the Design tab of Designer view and select all the fields in which the color of text needs to change. In this example, I’ll select all fields.

SQL Freelancer SQL Server SSRS
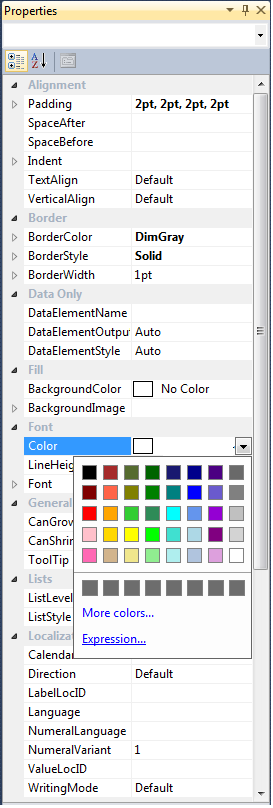
Next, I’ll go to the Properties Window. If you don’t see this window you can choose View, Properties or simply hit F4.

In the Properties Window click the arrow beside Color and choose Expression:

SQL Freelancer SQL Server SSRS

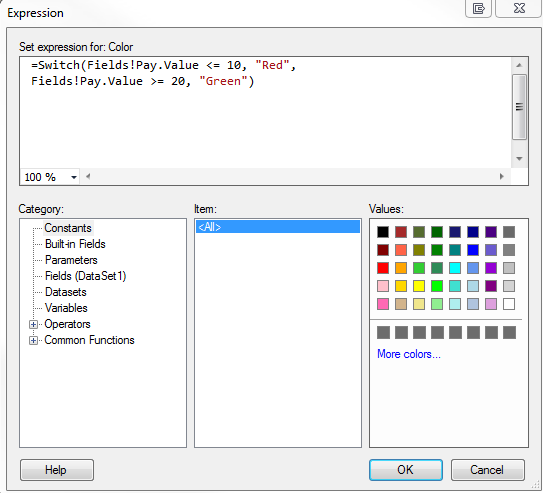
In the Expression box type your VB expression and click OK. In this example I’m using the following:

=SWITCH(Fields!Pay.Value <= 10, "Red", Fields!Pay.Value >= 20, "Green")

SQL Freelancer SQL Server SSRS
Click here to view the rest of this post.

Creating an SSRS Map report with data pinpoints

SQL Server Reporting Services has some cool features such as displaying maps and data points on the maps.  In this post I’ll show how to take a list of addresses and display them as pinpoints on a map in an SSRS report.

With SSRS 2008R2 you have the capability of adding maps to your reports using spatial data. In this tip I’ll show you how to accomplish this.

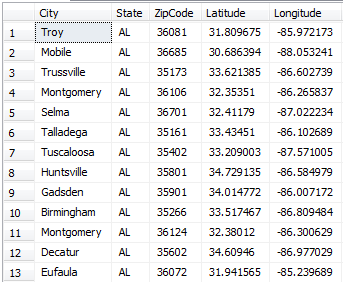
If you have a table with addresses, zip codes, etc. we’ll need to find the latitude and longitude of each address. You can accomplish this by using a geocoding website. There are many out there but I use http://www.gpsvisualizer.com/geocoder/ because it’s fast and easy to copy and paste multiple addresses into their input box, click “start geocoding” and within seconds it will output latitude and longitude information.

Once you get the latitude and longitude information you can import it into your database. See below for an example of my table of Alabama cities and zip codes with their appropriate coordinates.

SQL Freelancer SQL Server SSRS Maps

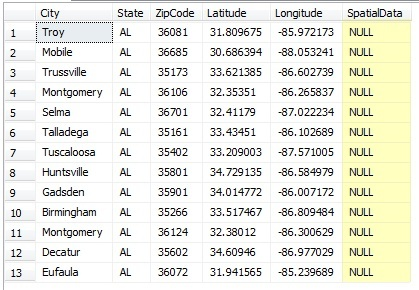
Once you have your coordinates we will need to create a new column with a geography data type that we will add our spatial data into. The following code will accomplish this.

ALTER TABLE ZipCodes ADD SpatialData geography

We should now have a table that looks like below:

SQL Freelancer SQL Server SSRS Maps

Inserting the data into the SpatialData column can be time consuming if you have a lot of records. The best way I have figured out how to do this is to use a basic UPDATE statement. Below is my script I have created for my table for this example.

UPDATE ZipCodes SET SpatialData = 'POINT(85.972173  31.809675)' WHERE ZipCode = 36081 
UPDATE ZipCodes SET SpatialData = 'POINT(88.053241  30.686394)' WHERE ZipCode = 36685
UPDATE ZipCodes SET SpatialData = 'POINT(86.602739  33.621385)' WHERE ZipCode = 35173
UPDATE ZipCodes SET SpatialData = 'POINT(86.265837  32.35351)' WHERE ZipCode = 36106 
UPDATE ZipCodes SET SpatialData = 'POINT(87.022234  32.41179)' WHERE ZipCode = 36701 
UPDATE ZipCodes SET SpatialData = 'POINT(86.102689  33.43451)' WHERE ZipCode = 35161 
UPDATE ZipCodes SET SpatialData = 'POINT(87.571005  33.209003)' WHERE ZipCode = 35402 
UPDATE ZipCodes SET SpatialData = 'POINT(86.584979  34.729135)' WHERE ZipCode = 35801 
UPDATE ZipCodes SET SpatialData = 'POINT(86.007172  34.014772)' WHERE ZipCode = 35901 
UPDATE ZipCodes SET SpatialData = 'POINT(86.809484  33.517467)' WHERE ZipCode = 35266 
UPDATE ZipCodes SET SpatialData = 'POINT(86.300629  32.38012)' WHERE ZipCode = 36124 
UPDATE ZipCodes SET SpatialData = 'POINT(86.977029  34.60946)' WHERE ZipCode = 35602 
UPDATE ZipCodes SET SpatialData = 'POINT(85.239689  31.941565)' WHERE ZipCode = 36072

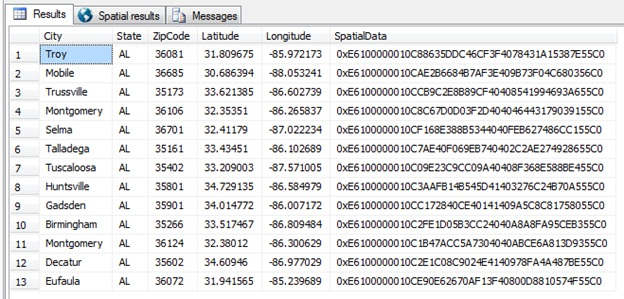
Once you update your table with the spatial data and run SELECT * FROM ZipCodes you should see the following output:

SQL Freelancer SQL Server SSRS Maps
Click here to view the rest of this post.