Performance Tuning Series – Storage Optimization: Maximizing Disk Performance

Efficient storage management is critical for SQL Server performance, as disk I/O is often the slowest component in the entire system. Poor disk performance can cause bottlenecks, leading to slow query response times and general system sluggishness. Optimizing storage involves using the right hardware, configuring SQL Server for optimal use of that hardware, and regularly maintaining the data stored on disk.

Understanding the Role of Disk I/O in SQL Server

SQL Server heavily relies on disk I/O to store and retrieve data. Every query that retrieves data from a table, reads or writes logs, or handles tempdb operations, interacts with the disk. Efficient storage optimization can drastically reduce I/O latency and increase throughput, leading to faster query execution times. Key areas where disk I/O impacts performance include:

  • Data and Index Pages: Stored on disk and loaded into memory when queried.
  • Transaction Logs: Sequential writes to disk that track all database modifications.
  • Tempdb: A shared workspace for temporary data storage, often involving frequent disk I/O.
  • Backups and Restores: Operations that require significant disk activity.

To minimize the impact of disk I/O on performance, several best practices can help ensure SQL Server maximizes its disk performance.

Best Practices for SQL Server Storage Optimization

1. Use High-Performance Storage Solutions

The type of storage you choose for SQL Server has a significant impact on overall performance. Mechanical hard drives (HDDs) are slow and can cause performance bottlenecks, especially in high-transactional environments. Instead, use the following types of storage for better performance:

  • Solid-State Drives (SSDs): SSDs offer faster read/write speeds compared to traditional spinning disks (HDDs). SSDs reduce the time it takes to retrieve data from disk, making them ideal for SQL Server databases that require low-latency access.
    • Best Practice: Use SSDs for your data, log files, and tempdb. This will drastically reduce I/O wait times, leading to faster query response times.
  • NVMe Drives: NVMe (Non-Volatile Memory Express) drives provide even better performance than SSDs by using a direct connection to the CPU, bypassing the traditional SATA interface. NVMe drives can offer lower latency and higher throughput, making them ideal for databases with high I/O demands.
    • Best Practice: For mission-critical databases that handle large volumes of transactions or queries, consider using NVMe drives for primary storage.
  • SAN (Storage Area Network): For larger environments, a SAN can offer centralized, high-speed storage. Ensure that your SAN is properly configured to handle the database workload, with enough bandwidth and redundancy to avoid bottlenecks.

2. Separate Data, Log, and Tempdb Files

SQL Server performs different types of I/O operations on its data, transaction log, and tempdb files, and these should be managed separately for optimal performance:

  • Data Files (MDF/NDF): These files handle random I/O as SQL Server reads and writes data across different parts of the database.
  • Transaction Logs (LDF): Transaction logs are written sequentially, and disk I/O is generally sequential. Transaction logs require high write performance to ensure efficient logging and recovery.
  • Tempdb Files: Tempdb handles temporary objects and query operations, and it often experiences high I/O. High activity in tempdb can lead to contention and performance degradation.

Best Practice: Place data, log, and tempdb files on separate physical drives or storage volumes to prevent I/O contention. This ensures that heavy I/O on one file type (such as a data read) does not slow down other critical operations like logging or tempdb transactions.

3. Optimize I/O Through Disk Striping (RAID)

Redundant Array of Independent Disks (RAID) is a technology used to improve disk performance and redundancy by distributing data across multiple drives. Different RAID levels provide varying balances of performance, redundancy, and cost.

  • RAID 1 (Mirroring): Provides redundancy by duplicating data across two drives. It offers fault tolerance but no performance benefits.
  • RAID 5 (Striping with Parity): Distributes data across several disks, with parity for fault tolerance. RAID 5 improves read performance but may suffer from slow write performance due to the overhead of parity calculations.
  • RAID 10 (Mirroring and Striping): Combines RAID 1 and RAID 0 to provide both redundancy and performance. RAID 10 offers faster read/write speeds and is ideal for high-performance SQL Server environments, although it requires more drives and is costlier.

Best Practice: For SQL Server, RAID 10 is often recommended for data files due to its balance of performance and fault tolerance. Transaction logs benefit from RAID 1, as sequential writes don’t require the parity overhead of RAID 5.

4. Optimize Tempdb Performance

Tempdb is a shared system database that handles temporary data, intermediate results for queries, and row versioning. It can become a significant performance bottleneck, especially in high-concurrency environments.

  • Best Practice: To optimize tempdb:
    • Use multiple tempdb files: SQL Server allows you to configure multiple tempdb data files to reduce contention and improve throughput. Ideally, you should have one tempdb file per logical CPU core (up to 8 cores).
    • Place tempdb on fast storage: Since tempdb is highly I/O-intensive, place it on the fastest storage available (preferably SSD or NVMe).
    • Monitor tempdb usage: Regularly monitor tempdb for signs of contention (such as high waits on PFS, GAM, or SGAM pages). This can indicate the need for additional tempdb files or further optimization.

5. Monitor Disk I/O Performance

Regularly monitoring disk performance is essential to identify and address bottlenecks before they affect SQL Server. You can use SQL Server’s built-in tools and OS-level monitoring tools to track I/O performance.

  • Best Practice: Monitor the following key metrics:
    • Disk Latency: Track disk latency (measured in milliseconds). Ideally, disk read/write latency should be under 10ms for SSDs and under 1ms for NVMe drives. High latency indicates storage performance issues.
    • Disk Queue Length: This metric shows how many requests are waiting to be processed by the disk. Long disk queues indicate that SQL Server is overloading the storage subsystem.
    • Read/Write IOPS: Input/output operations per second (IOPS) provide a measure of how efficiently your storage can handle the database’s read/write workload. Compare actual IOPS with the capacity of your storage hardware to ensure it meets the demand.
  • Tools for Monitoring:
    • SQL Server Performance Monitor (PerfMon): Tracks disk performance counters like Avg. Disk sec/Read and Avg. Disk sec/Write, providing insight into disk latency.
    • SQL Server Dynamic Management Views (DMVs): DMVs like sys.dm_io_virtual_file_stats offer real-time insights into SQL Server disk I/O activity at the database and file level.

6. Enable Data Compression

SQL Server offers data compression features that can reduce the size of data stored on disk, leading to lower storage requirements and potentially improved performance by reducing I/O.

  • Best Practice: Consider enabling row-level or page-level compression on tables that experience heavy read activity. Compression reduces the number of data pages SQL Server has to read from disk, decreasing I/O and improving query performance.
    • Row-Level Compression: Minimizes the storage footprint of individual rows without adding significant CPU overhead.
    • Page-Level Compression: Compresses data at the page level, providing greater space savings, but requires more CPU resources.

Regularly review data access patterns to determine which tables or indexes would benefit most from compression, particularly in environments with large datasets and frequent queries.

7. Regular Index Maintenance

Fragmented indexes can cause SQL Server to perform extra I/O when retrieving data, leading to performance issues. Regular index maintenance ensures that SQL Server performs efficiently.

  • Best Practice: Rebuild or reorganize fragmented indexes periodically to optimize disk usage and reduce unnecessary I/O.
    • Use index rebuilds for heavily fragmented indexes (over 30% fragmentation) to completely rebuild the index structure.
    • Use index reorganization for moderately fragmented indexes (10-30% fragmentation) to re-sort data pages without fully rebuilding the index.

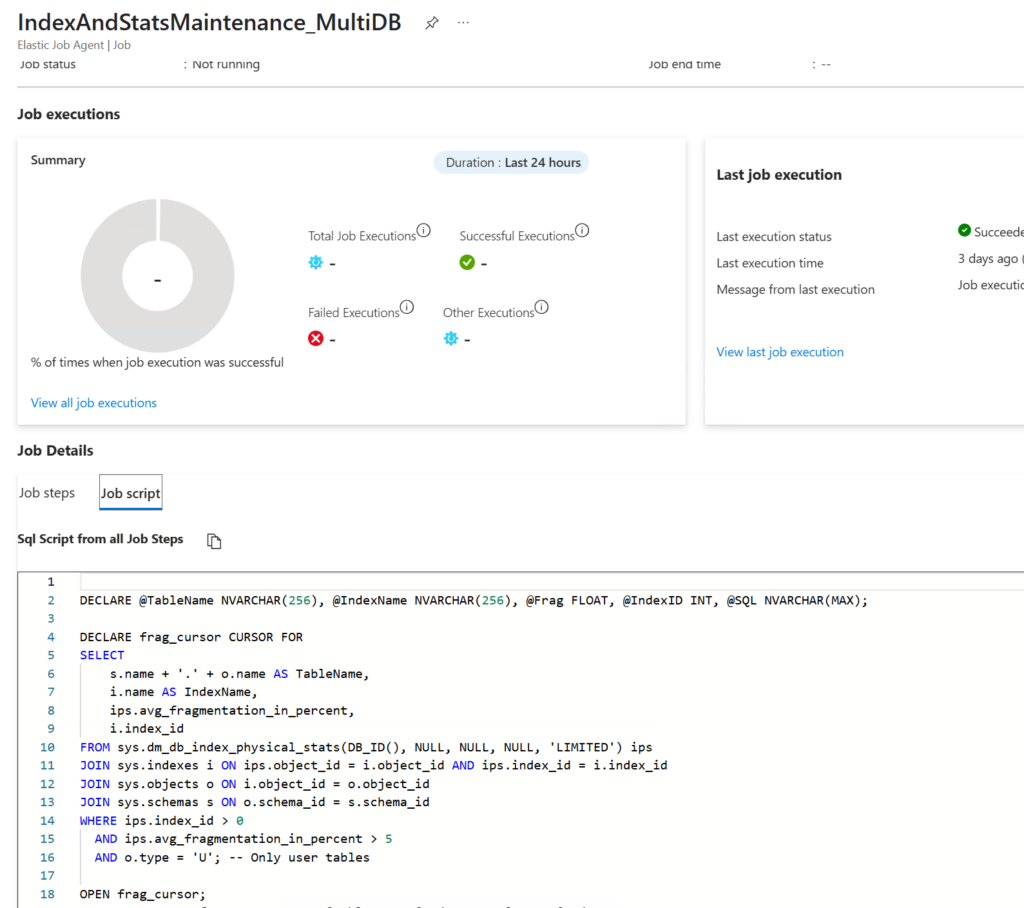
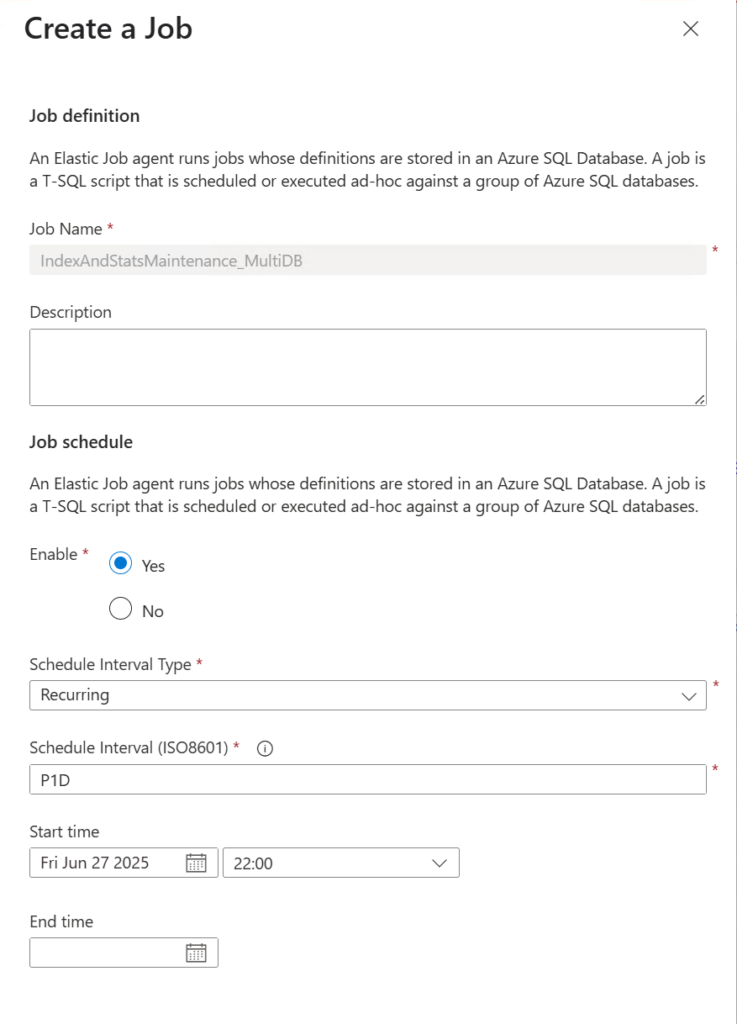
Automate index maintenance tasks to ensure they are regularly performed without manual intervention.

Conclusion

Storage optimization is key to achieving high performance in SQL Server environments. By using the right storage hardware, segregating data, log, and tempdb files, utilizing RAID configurations, and regularly monitoring disk performance, you can minimize I/O bottlenecks and ensure your SQL Server operates efficiently. When combined with regular index maintenance, compression, and proper tempdb management, a well-optimized storage system forms the foundation of a performant SQL Server instance.

Performance Tuning Series – Memory Management

Memory management plays a pivotal role in SQL Server performance. SQL Server uses memory for various purposes, including caching data, storing query plans, and running queries. Proper memory configuration ensures that SQL Server uses resources efficiently, providing optimal query response times and preventing performance degradation. Mismanagement, however, can lead to high memory pressure, slow query execution, or even out-of-memory errors.

SQL Server’s Memory Architecture

SQL Server primarily relies on two types of memory: Buffer Pool and Query Workspace Memory. The Buffer Pool is responsible for caching data pages to reduce disk IO operations, while Query Workspace Memory is used for sorting, hashing, and other operations that require in-memory processing during query execution. Understanding how SQL Server uses memory can help in diagnosing and optimizing memory-related issues.

Best Practices for Memory Management

  1. Set Appropriate Maximum and Minimum Memory Limits:
    • SQL Server dynamically allocates memory, but by default, it can use almost all available system memory, potentially starving other processes (including the operating system) of necessary resources. To prevent this, it’s essential to configure the Maximum Server Memory setting in SQL Server.
    • Best Practice: Set the max server memory to leave sufficient memory for the OS and other critical processes. A general recommendation is to reserve around 10-20% of the total system memory for the operating system.
    • Example: If your server has 32 GB of RAM, you might configure SQL Server to use 25-28 GB, leaving 4-6 GB for the OS and other applications.
    • The min server memory setting is usually less critical but can be useful in environments where SQL Server competes with other applications for memory. Setting a reasonable minimum ensures that SQL Server has a baseline of memory even during high competition for system resources.
  2. Monitor and Manage Memory Pressure:
    • Memory pressure occurs when SQL Server runs low on available memory for operations, leading to performance degradation. There are two main types of memory pressure: internal (caused by SQL Server needing more memory than what’s allocated) and external (caused by other processes on the same server consuming memory).
    • Best Practice: Monitor key indicators like page life expectancy (PLE), which measures how long a page stays in the buffer pool before being flushed out. A rapidly declining PLE may signal memory pressure, as pages are being flushed from memory too quickly. Values under 300 seconds typically indicate memory pressure.
  3. Optimize Buffer Pool Usage:
    • SQL Server’s Buffer Pool is a crucial area of memory used to cache frequently accessed data pages, reducing the need for disk IO, which is much slower. Efficient buffer pool management can drastically improve database performance by minimizing physical reads.
    • Best Practice: Ensure that enough memory is available to store hot data sets in the buffer pool. Regularly accessed tables and indexes should ideally fit into memory to avoid constant paging to and from disk.
    • Use the sys.dm_os_buffer_descriptors DMV to monitor buffer pool utilization and identify which database pages are consuming the most memory. If large, rarely used tables are consuming too much memory, consider indexing or partitioning strategies to optimize memory usage.
  4. Monitor Query Workspace Memory:
    • Query Workspace Memory is used for internal operations like sorting, hashing, and other in-memory data processing tasks. If these operations consume too much memory, SQL Server will spill them to disk, significantly slowing down query execution due to the additional IO overhead.
    • Best Practice: Monitor the sort warnings and hash warnings using the sys.dm_exec_query_stats DMV. These warnings indicate that SQL Server ran out of memory and had to spill to disk during a query operation. If such warnings are frequent, consider increasing the available memory or optimizing the queries involved to use less memory.
    • Query operations that sort large result sets or perform complex joins are often memory-intensive. You can reduce memory consumption by rewriting queries to process fewer rows, adding indexes to avoid large sorts, or splitting the workload into smaller, more manageable batches.
  5. Control Memory for In-Memory OLTP:
    • SQL Server offers In-Memory OLTP (also known as Hekaton), which stores data in memory-optimized tables, providing faster read and write access. However, In-Memory OLTP comes with its own memory management considerations since all data in memory-optimized tables must fit into memory.
    • Best Practice: Ensure that the server has sufficient memory to store both memory-optimized tables and other critical SQL Server processes. Set a dedicated memory pool for In-Memory OLTP using the memory_optimized_data configuration. This helps SQL Server manage how much memory can be used for In-Memory OLTP without starving other processes.
    • Monitor the memory usage of In-Memory OLTP via the sys.dm_db_xtp_table_memory_stats DMV to ensure it’s functioning efficiently and not consuming an excessive amount of memory.
  6. Optimize SQL Server for NUMA (Non-Uniform Memory Access) Architecture:
    • NUMA is a memory architecture that divides memory into nodes associated with specific CPUs. SQL Server is NUMA-aware and can optimize memory usage based on the NUMA configuration, improving performance for multi-CPU systems.
    • Best Practice: Ensure that SQL Server is correctly configured to take advantage of NUMA. If SQL Server is running on a NUMA-enabled server, monitor NUMA node memory allocation using the sys.dm_os_nodes DMV. SQL Server can experience bottlenecks if memory allocations are not balanced across NUMA nodes, so check for uneven workloads across nodes.
    • If necessary, configure SQL Server’s affinity mask settings to control which CPUs and NUMA nodes SQL Server uses, ensuring that memory access remains efficient.
  7. Cache and Plan Management:
    • SQL Server caches query execution plans in memory to avoid recompiling the same queries repeatedly, reducing CPU load and speeding up query execution. However, inefficient query plans or cache bloating can waste memory and degrade performance.
    • Best Practice: Regularly monitor the plan cache using the sys.dm_exec_cached_plans DMV to identify and remove inefficient or rarely used plans. You can also look for parameter sniffing issues, where SQL Server generates an inefficient plan based on initial parameter values and reuses it for other queries, even if it’s not optimal.
    • Use optimize for ad hoc workloads configuration to reduce memory consumption by ad hoc queries. This setting caches only the plan stub for single-use queries, instead of the full plan, reducing memory overhead for queries that are executed only once.

Monitoring and Diagnosing Memory Issues

    • SQL Server provides several dynamic management views (DMVs) to help you monitor memory usage:
      • sys.dm_os_sys_memory: Provides an overview of the system’s memory usage, including total memory, available memory, and memory pressure status.
      • sys.dm_os_memory_clerks: Shows detailed information about memory clerks, which are internal components that track memory usage for various SQL Server operations like buffer pool and query execution.
      • sys.dm_exec_memory_grants: Displays memory grants for currently executing queries, helping to identify queries that are consuming large amounts of memory.
    • Regularly review these DMVs to ensure memory is being used efficiently, and address any queries or operations that are causing excessive memory consumption.

Conclusion

Efficient memory management is crucial for ensuring SQL Server performs at its best. By setting appropriate memory limits, monitoring key metrics, and optimizing memory usage across the buffer pool, query workspace, and In-Memory OLTP, you can prevent memory bottlenecks and ensure that your database server runs smoothly. Proper memory management, combined with regular monitoring, allows you to proactively address issues and maintain optimal performance for your SQL Server instances.

Maintenance Windows for Azure SQL

The cloud has revolutionized the way we manage and maintain databases, offering new features and capabilities to enhance reliability and minimize disruptions. One such feature that has garnered significant attention is the maintenance window for Azure SQL Database.

Microsoft’s maintenance window feature allows database administrators to schedule planned maintenance events for Azure SQL Database resources during non-peak hours, effectively reducing the impact on mission-critical production workloads. By configuring a maintenance window, we can ensure that updates, patches, and other maintenance activities occur at a time that minimizes disruptions to our business operations.

The true power of this feature lies in its flexibility and customization options. While Azure SQL Database follows a default maintenance window designed to align with typical business hours, administrators can tailor the maintenance schedule to suit their unique requirements. Whether it’s opting for weekday or weekend maintenance slots, the ability to choose a time frame that aligns with our specific operational needs is a game-changer.

Moreover, the maintenance window feature comes with built-in advance notifications, allowing us to stay informed and prepared for upcoming maintenance events. This proactive approach enables us to plan accordingly, minimizing potential downtime and ensuring a smooth transition during the maintenance process.

It’s worth noting that the maintenance window is available for most service level objectives (SLOs) within Azure SQL Database, ensuring that organizations with diverse performance and availability requirements can benefit from this feature.

As database administrators, we understand the critical importance of maintaining a reliable and high-performing database infrastructure. The maintenance window feature in Azure SQL Database empowers us to strike the right balance between keeping our systems up-to-date and minimizing disruptions to business operations.

I encourage my fellow database professionals to explore this feature and leverage its capabilities to optimize their maintenance strategies. By doing so, we can enhance the reliability and availability of our database systems, ultimately contributing to the success of our organizations.

Click here to read more…

Performance Tuning Series – Writing Efficient SQL

Welcome back to our Performance Tuning Series. In the previous post, we discussed Indexing Strategies which is a key component in having optimal query performance. We’ll continue in the series with a post on writing efficient SQL to expand on even better performance for your SQL Server queries.

Optimizing SQL queries is at the heart of database performance. Even with the best hardware and properly indexed tables, poorly written queries can slow down your SQL Server. Efficient SQL writing isn’t just about getting the right results; it’s about getting them quickly and with minimal resource consumption. Here’s how you can write SQL queries that are both efficient and effective.

Key Principles of Query Optimization

  1. Understand SQL Server Execution Plans:
    • An execution plan is a roadmap of how SQL Server will execute a query. It shows the steps taken to retrieve the data, including the order of operations, the use of indexes, and the estimated cost of each operation.
    • Use the “Include Actual Execution Plan” feature in SQL Server Management Studio (SSMS) to analyze how SQL Server processes your queries. Look for signs of inefficiency such as table scans (where the server reads every row in a table) and key lookups (which occur when a non-clustered index doesn’t cover all the columns needed by the query).
    • Pay attention to the “cost” associated with each step in the execution plan. High-cost operations are potential areas for optimization, such as converting table scans into index seeks.
  2. Try to avoid SELECT * :
    • While it’s tempting to use SELECT * to fetch all columns from a table, it can lead to unnecessary data retrieval, increased IO, and slower performance, especially in tables with many columns or large data types.
    • Instead, specify only the columns you need in the SELECT statement. This reduces the amount of data transferred and processed, leading to faster query execution and reduced network traffic.
    • Specifying columns also makes your queries easier to maintain. If the table schema changes (e.g., a column is added or removed), your query is less likely to break or produce unexpected results.
  3. Use Proper JOINs:
    • Understanding and using the correct type of JOINs in your queries is crucial for performance. The most commonly used JOINs are INNER JOIN, LEFT JOIN, and RIGHT JOIN, each serving different purposes.
    • INNER JOIN: Returns only the rows where there is a match in both joined tables. This is the most efficient JOIN type in most cases.
    • LEFT JOIN (or LEFT OUTER JOIN): Returns all rows from the left table and matched rows from the right table, with NULLs for non-matching rows. While useful, LEFT JOINs can be more resource-intensive, especially if the right table is large and has many unmatched rows.
    • RIGHT JOIN: Similar to LEFT JOIN, but returns all rows from the right table and matched rows from the left. It is less commonly used and can often be rewritten as a LEFT JOIN by reversing the order of the tables.
    • CROSS JOIN: Returns the Cartesian product of the two tables, which means every row in the first table is combined with every row in the second table. This JOIN type is usually not recommended unless you explicitly need all possible combinations, as it can result in an extremely large dataset and high resource usage.
    • Ensure that you have appropriate indexes on the columns used in the JOIN conditions to prevent full table scans.
  4. Leverage Query Hints Carefully:
    • SQL Server provides query hints that can override the default behavior of the query optimizer. While these can be powerful tools in specific scenarios, they should be used cautiously, as they can sometimes force suboptimal execution plans.
    • FORCESEEK: Forces SQL Server to use an index seek instead of a scan. This hint can be helpful when you know an index exists and should be used, but SQL Server is choosing a scan instead.
    • NOLOCK: Allows reading uncommitted data (dirty reads). This hint can improve performance in scenarios where slight inaccuracies are acceptable, but it should be used with caution as it can lead to inconsistent results.
    • MAXDOP: Controls the maximum degree of parallelism for a query, limiting how many CPU cores can be used. This can be useful for balancing query performance with overall server workload.
    • Use query hints as a last resort after ensuring that the query structure and indexes are optimized.
  5. Optimize Subqueries and CTEs:
    • Subqueries and Common Table Expressions (CTEs) are powerful tools in SQL but can be performance traps if not used wisely.
    • Subqueries: These can be used in SELECT, WHERE, or FROM clauses. While they are convenient, subqueries in the WHERE clause (known as correlated subqueries) can significantly slow down query performance, as they are often executed for every row in the outer query. Whenever possible, refactor correlated subqueries into JOINs or use EXISTS instead of IN to check for the existence of rows.
    • CTEs: CTEs can make complex queries easier to read and maintain, but they are not inherently optimized. Treat CTEs as you would any other subquery: be mindful of their performance impact, especially in recursive CTEs, which can be resource-intensive.
    • For both subqueries and CTEs, consider whether the same logic could be implemented using derived tables, JOINs, or even temporary tables, which can sometimes offer better performance.
  6. Parameterize Queries:
    • Parameterized queries allow you to reuse execution plans, improving performance and reducing the risk of SQL injection attacks.
    • Avoid using dynamic SQL, where queries are built as strings with hard-coded values. Dynamic SQL not only makes queries more prone to SQL injection but also prevents SQL Server from caching execution plans, leading to slower performance.
    • Use parameters to pass values into your queries. SQL Server can cache the execution plan for parameterized queries, leading to faster subsequent executions.
  7. Manage Temporary Objects Wisely:
    • Temporary tables, table variables, and Common Table Expressions (CTEs) are often used to store intermediate results within a query. Each has its performance implications, and choosing the right one is critical.
    • Temporary Tables: These are physically created in the TempDB database and can be indexed, making them suitable for storing large result sets or performing complex operations. However, they can be slower to create and access due to disk IO.
    • Table Variables: Stored in memory, table variables are faster for small datasets but lack statistics, which can lead to suboptimal execution plans. They are a good choice when dealing with small, temporary datasets.
    • CTEs: As mentioned earlier, CTEs are great for improving query readability but should be used carefully. They do not persist results, meaning the underlying query is re-executed every time the CTE is referenced, potentially leading to performance issues with complex CTEs.
    • Choose the appropriate temporary object based on the size of your dataset and the complexity of your operations. Monitor the performance impact of these objects using tools like SQL Profiler or execution plans.
  8. Optimize Sorting and Filtering:
    • Sorting and filtering data can be resource-intensive, especially on large datasets. To optimize these operations:
    • Indexes: Ensure that your indexes support the sort and filter operations. For example, if you frequently order by a particular column, consider creating an index on that column.
    • WHERE Clauses: Be mindful of the conditions in your WHERE clauses. Use indexes to avoid full table scans, and consider using EXISTS instead of IN when checking for the existence of rows, as it often provides better performance.
    • GROUP BY and HAVING: GROUP BY can be expensive, especially when used with large datasets. Ensure that the columns used in GROUP BY are indexed, and avoid using HAVING unless absolutely necessary, as it filters data after the aggregation, leading to additional processing.
  9. Limit the Use of Cursors:
    • Cursors allow you to iterate through rows one at a time, but they can be slow and resource-intensive, as they process each row individually rather than in sets.
    • Whenever possible, replace cursors with set-based operations, which are far more efficient in SQL Server. For example, use a single UPDATE statement to modify multiple rows instead of iterating through rows with a cursor.

Conclusion

Optimizing SQL queries is an essential skill for any SQL Server professional. By writing efficient queries, you can significantly reduce the load on your database, speed up data retrieval, and improve the overall performance of your applications. Following these best practices for query optimization will help ensure that your SQL Server databases operate at peak efficiency, providing fast and reliable access to the data your business depends on.

Performance Tuning Series – Indexing Strategies: The Cornerstone of Performance

In today’s data-driven world, the performance of your SQL Server databases is critical to the success of your business. Slow queries, lagging response times, and inefficient resource utilization can lead to significant downtime, affecting your bottom line. Optimizing SQL Server performance isn’t just about quick fixes; it requires a strategic approach to database design, indexing, and query optimization. In this blog post series, we’ll explore best practices that can help you enhance the performance of your SQL Server databases, ensuring they run efficiently and reliably starting with Indexing Strategies.

Indexes are fundamental to SQL Server performance optimization. They work by creating a structured pathway to your data, allowing the SQL Server engine to locate rows much faster than it would by scanning an entire table. However, indexing is a double-edged sword: while proper indexing can dramatically improve query performance, poor indexing strategies can lead to slower performance, increased storage requirements, and higher maintenance costs.

Understanding the Types of Indexes

Before diving into best practices, it’s crucial to understand the types of indexes available in SQL Server and their specific use cases:

  • Clustered Indexes: A clustered index determines the physical order of data in a table. There can only be one clustered index per table because the data rows themselves are stored in the index structure. This type of index is ideal for columns frequently used in range queries, such as date ranges, where the physical ordering of data can speed up retrieval. When a table has a clustered index, the table is called a clustered table. If a table has no clustered index, its data rows are stored in an unordered structure called a heap or heap table.
  • Non-Clustered Indexes: Unlike clustered indexes, non-clustered indexes create a separate structure within the table that holds the index key values and pointers to the corresponding data rows. A table can have multiple non-clustered indexes, and they are beneficial for speeding up searches, sorts, and joins on columns that aren’t the primary key.
  • Unique Indexes: These are non-clustered indexes that enforce uniqueness on the indexed columns. They are crucial for ensuring data integrity, particularly on columns like email addresses or social security numbers.
  • Full-Text Indexes: Used to support full-text queries against character-based data, these indexes are ideal for columns containing large texts, like product descriptions or document contents. They are particularly useful for implementing search features within your database.

Key Indexing Best Practices:

  1. Choose the Right Columns for Indexing:
    • Focus on columns used frequently in WHERE, JOIN, ORDER BY, and GROUP BY clauses. These are the columns that SQL Server must search, sort, or join often, making them prime candidates for indexing.
    • Index foreign key columns to improve join performance between related tables.
    • Consider indexing columns used in filters, for example, a WHERE clause, that can reduce the number of rows returned significantly, as this can drastically speed up query performance.
  2. Avoid Over-Indexing:
    • While indexing can improve read performance, each additional index incurs a cost in terms of storage space and the time required for write operations (INSERT, UPDATE, DELETE). Each time data is modified, SQL Server must also update the associated indexes, which can lead to slower performance for write-heavy applications.
    • To avoid over-indexing, periodically review the indexes in your database using SQL Server’s sys.dm_db_index_usage_stats DMV. This view helps identify indexes that are rarely used or never used at all, which can be candidates for removal.
  3. Implement Covering Indexes:
    • A covering index includes all the columns referenced in a query, meaning the query can be satisfied entirely from the index without having to access the actual data table. This reduces IO operations and can significantly speed up query performance.
    • For example, if a query frequently selects columns A, B, and C, create a non-clustered index on these columns. The SQL Server engine can then retrieve the needed data directly from the index, bypassing the need for key lookups.
  4. Consider the Order of Columns in Multi-Column Indexes:
    • The order of columns in a multi-column index matters. Place the most selective column (the one that narrows down the result set the most) first in the index. This strategy ensures that SQL Server can effectively reduce the number of rows to be processed early in the execution plan.
    • For instance, if you have an index on columns (LastName, FirstName), but most of your queries filter by FirstName, you might want to reverse the order to (FirstName, LastName) for better performance.
  5. Monitor and Maintain Indexes Regularly:
    • Index fragmentation can degrade performance over time, particularly on large tables. Fragmentation occurs when the logical order of pages in an index does not match the physical order, leading to inefficient read operations.
    • Regularly rebuild or reorganize indexes to mitigate fragmentation. Rebuilding an index recreates the entire index, removing fragmentation but at the cost of higher resource usage. Reorganizing is a lighter operation that compacts the index and defragments it without fully recreating it.
    • I recommend using Ola Hallengren’s maintenance solution for index maintenance, but you can also use the built-in SQL Server Maintenance Plan Wizard or other custom scripts to schedule and automate index maintenance tasks.
  6. Leverage Filtered Indexes:
    • Filtered indexes are non-clustered indexes that include only a subset of rows from the table, based on a defined filter condition. They are particularly useful when you only need to index a portion of the data.
    • For example, if a table stores both active and inactive records, and most queries only access active records, you can create a filtered index on the Status column where Status = 'Active'. This smaller index consumes less storage and is faster to maintain while improving query performance for the active records.

Performance Troubleshooting

When diagnosing performance issues, poorly optimized indexes are often the culprit. Tools like Brent Ozar’s sp_BlitzIndex, SQL Server Execution plans, and SQL Server DMV’s can provide index recommendations based on the workload. However, these recommendations should be carefully evaluated before implementation, as they might not always align with your database’s specific needs.

Indexing + Partitioning

For very large tables, consider combining indexing with partitioning. Partitioning divides a table into smaller, more manageable pieces, each of which can be indexed independently. This strategy can significantly improve performance, especially for queries that target specific partitions, such as date ranges.

Conclusion

Effective indexing is both an art and a science, requiring a deep understanding of your data, queries, and SQL Server’s behavior. By implementing these indexing strategies, you can ensure your SQL Server databases perform at their best, providing quick, efficient access to the data your business depends on.

Solving Data Problems: The 💙of SQL Freelancer

At SQL Freelancer, we’re passionate about one thing: solving your data problems. We’re not a sales agency trying to push services you don’t need. We’re a team of experienced SQL Server professionals dedicated to helping you navigate the complexities of your data.

Your Data, Our Expertise

Data is the lifeblood of modern businesses, and we understand how crucial it is to get it right. Whether you’re facing performance bottlenecks, database inefficiencies, or data integrity issues, we’re here to help. Our goal is simple: to make your data work for you, not the other way around.

We Don’t Sell Solutions, We Build Them

Unlike many consulting firms, we don’t approach our clients with a one-size-fits-all solution. We listen to your unique challenges, understand your specific needs, and develop tailored strategies to address them. Our focus is on delivering tangible results that solve real problems, not just selling a service.

A Partnership, Not a Transaction

When you work with SQL Freelancer, you’re not just hiring a consultant—you’re gaining a partner. We take the time to understand your business, your goals, and your challenges. Our success is measured by your success, and we’re committed to being there every step of the way as you grow and evolve.

Why We Love What We Do

Every project we take on is an opportunity to dive deep into a new challenge, to apply our skills, and to make a meaningful difference for our clients. We’re problem solvers at heart, and nothing gives us more satisfaction than seeing our clients overcome obstacles and achieve their objectives.

Let’s Solve Your Data Problems Together

If you’re facing a data challenge and need expert guidance, we’re here to help. At SQL Freelancer, it’s not about selling you a service—it’s about solving your problems and empowering your business to thrive. Let’s work together to unlock the full potential of your data.

Delivering AI capabilities in SQL Server and Azure SQL

Delivering AI capabilities in SQL Server and Azure SQL

As a seasoned database administrator, I can’t help but express my excitement about the latest development in integrating generative AI models into SQL Server and Azure SQL. Microsoft’s recent article sheds light on how we can effortlessly harness the power of AI within our database environments, unlocking a new realm of possibilities.

The seamless integration of generative AI models into SQL Server and Azure SQL is a game-changer. No longer do we need to navigate complex external connections or wrestle with intricate architectures. With a simple SQL query, we can tap into the vast potential of AI, empowering us to generate text-based content, gain insights, and make data-driven decisions like never before.

What truly sets this integration apart is its scalability and performance. These AI capabilities can handle large datasets and high traffic without breaking a sweat, ensuring that our data remains always up-to-date and our operations run smoothly. This level of efficiency and data freshness is crucial in today’s fast-paced business landscape.

But the implications of this integration extend far beyond mere convenience. By bringing AI directly into our database environments, we are paving the way for a future where data and intelligence are seamlessly intertwined. Imagine the possibilities – from automated report generation to predictive analytics and beyond, the boundaries of what we can achieve with our data are being pushed further than ever before.

As database administrators, it is our responsibility to stay ahead of the curve and embrace technologies that can truly revolutionize how we work. The integration of generative AI models into SQL Server and Azure SQL is a prime example of such a transformative advancement.

I encourage all my fellow DBAs to explore this exciting development and start experimenting with the power of AI within their database environments. Let’s collaborate, share our experiences, and collectively shape the future of data management.

To get started, I highly recommend checking out Microsoft’s step-by-step guide on using SQL Server and Azure SQL to generate text-based content with generative AI. It’s a fantastic resource that will walk you through the process and help you unlock the full potential of this groundbreaking integration.

Let’s embrace the future and harness the power of AI to drive innovation, efficiency, and data-driven decision-making in our organizations. The time is now, and the opportunities are boundless.

Get Ahead of Year-End with Bulletproof Database Solutions

As we approach the final stretch of the year, businesses across all industries are gearing up for the increased demands that come with Q4. From handling higher transaction volumes to meeting year-end reporting requirements, your SQL databases will be put to the test. At SQL Freelancer, we understand the critical role that a robust, secure, and optimized database plays in ensuring your operations run smoothly during this peak season.

Why Your Q4 Success Depends on Your Database

The last quarter of the year can be a make-or-break time for many businesses. Whether you’re dealing with a surge in online orders, closing out the fiscal year, or preparing for tax season, your database needs to perform at its best. Any hiccups in your database can lead to delays, data loss, or even security breaches, all of which can severely impact your bottom line.

This is where SQL Freelancer comes in. Our Q3 marketing campaign, “Prepare for Q4 with SQL Expertise,” is designed to help you proactively address potential issues before they arise. By partnering with us, you can ensure that your SQL solutions are ready to handle whatever Q4 throws your way.

What We Offer:

  • Comprehensive Database Audits: We’ll perform a thorough analysis of your current database setup, identifying any weaknesses or areas for improvement.
  • Security Enhancements: Protect your data from breaches with our advanced security measures tailored to your specific needs.
  • Performance Optimization: Ensure your databases run efficiently under heavy loads, reducing latency and improving user experience.
  • Scalability Planning: Prepare for growth by ensuring your databases can scale seamlessly with your business needs.

Don’t Let Your SQL Databases Fall Behind

As you gear up for Q4, don’t let your SQL databases be an afterthought. With SQL Freelancer by your side, you can be confident that your solutions are secure, optimized, and ready for anything. We’re committed to helping you prepare, protect, and excel—so you can focus on what you do best.

Partner with the Leader in SQL Solutions

At SQL Freelancer, we pride ourselves on being a leader in SQL solutions. Our team of experts is dedicated to providing top-notch service, tailored to your unique business needs. Don’t leave your Q4 success to chance—partner with us and get ahead of the curve.

Ready to get started? Contact us today to learn how we can help you prepare for Q4 with bulletproof database solutions.

Introducing database watcher for Azure SQL

Reliable, in-depth, and at-scale monitoring of database performance has been a long-standing top priority for SQL customers. Today, we are pleased to announce the public preview of database watcher for Azure SQL, a managed database monitoring solution to help our customers use Azure SQL reliably and efficiently.


Managed monitoring for Azure SQL

To enable database watcher, you do not need to deploy any monitoring infrastructure or install and maintain any monitoring agents. You can create a new watcher and start monitoring your Azure SQL estate in minutes.


Once enabled, database watcher collects detailed monitoring data from your databases, elastic pools, and managed instances into a central data store in your Azure subscription. Data is collected with minimal latency – when you open a monitoring dashboard, you see database state as of just a few seconds ago.

Read more here…

The Misconception of Slow Queries in SQL Server


As a SQL Server DBA, one of my regular tasks is to monitor and optimize the performance of SQL Server databases. A common tool in my arsenal is a script that retrieves the top 10 slowest queries. However, there’s a crucial misconception that needs to be addressed: just because a query appears in this list doesn’t necessarily mean it’s slow or inefficient.

Understanding the Top 10 Slowest Queries

When we ask SQL Server to provide the top 10 slowest queries, it’s essential to understand what we’re actually requesting. The server is simply returning the queries that have the longest duration or highest resource usage among those that were executed during the monitoring period. This does not automatically imply that these queries are poorly written or unoptimized.

Why Optimal Queries Can Appear in the Top 10

There are several reasons why perfectly optimized queries might show up in your top 10 slowest queries list:

  1. High Frequency of Execution: A query that is executed very frequently may have a cumulative duration that places it in the top 10, even if each individual execution is fast.
  2. Data Volume: Queries that operate on large datasets may naturally take longer to execute, even if they are optimized for efficiency.
  3. System Load: External factors such as system load, network latency, or resource contention can temporarily increase the execution time of queries.
  4. Nature of the Task: Some queries are inherently time-consuming due to the complexity of the task they perform, such as complex joins, aggregations, or calculations.

Interpreting the Results

When you identify a query in the top 10 slowest list, it’s important to analyze it in context. Consider the following:

  • Execution Plan: Review the execution plan to check for any inefficiencies or areas for improvement.
  • Frequency of Execution: Determine how often the query is executed and whether its cumulative impact is significant.
  • Data Volume: Assess whether the query is handling large volumes of data and if there are ways to reduce the dataset size.
  • Resource Usage: Look at the resources the query is consuming and explore ways to optimize resource utilization.
  • Comparison with Baselines: Compare the query’s performance with historical baselines to identify any anomalies or trends.

In summary, appearing in the top 10 slowest queries list doesn’t automatically condemn a query as slow or inefficient. It’s a starting point for further investigation and analysis. As a SQL Server DBA, my role is to dig deeper, understand the context, and make informed decisions about optimization. By doing so, we can ensure that our databases run smoothly and efficiently, supporting the needs of our organizations.