I’ve been noticing a lot of deadlocks on my server. What’s the best way to track down the queries so I can fix the problem?
There are a few different ways that you can capture deadlock information. You can setup a trace flag (1222) to write the deadlock information to the error log, setup a Profiler trace to capture the deadlock graph, or setup an Extended Event to capture all sorts of information.
I’m going to focus on setting up an Extended Event in this post since MS continues to say Profiler will not be released in future versions. Extended Events are the future so why not start using them now?
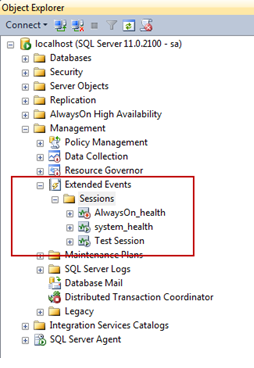
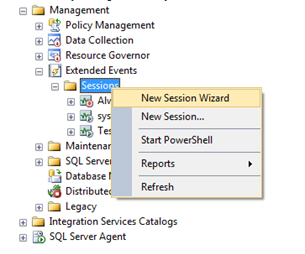
In SSMS, drill down to Management, Extended Events. Right click on Sessions and click New Session Wizard:

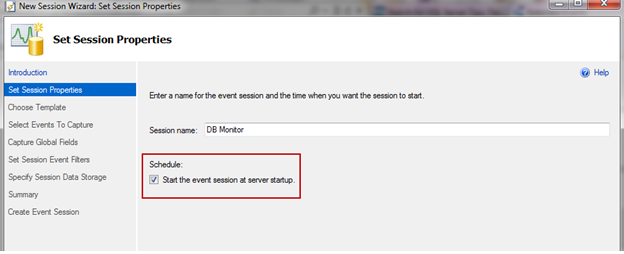
Click next on the Introduction screen and give the Session a name. I’m going to name this session Deadlocks:

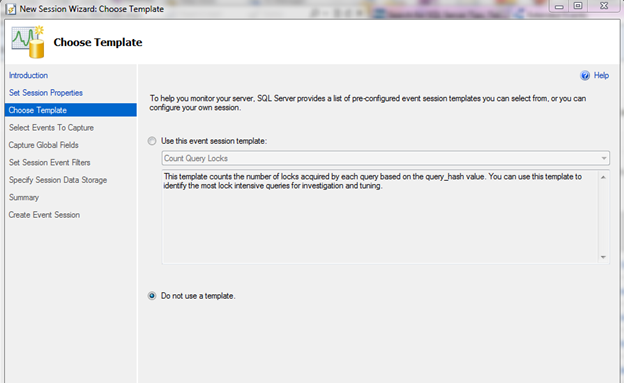
Click next. On the Choose Template screen you can choose a predefined template (like Profiler) or you can create your own events by choosing “Do not use a template”. For this post, let’s create our own:

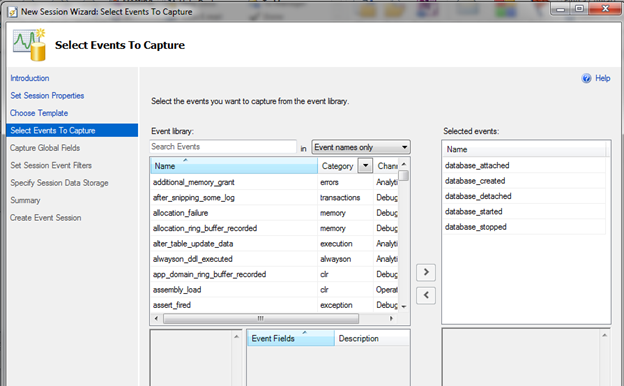
Click next and you’ll see hundreds of events (like Profiler). We only want to capture deadlock data so let’s scroll down to the very bottom and choose xml_deadlock_report. Click on the event and click the right arrow to move it into the Selected Events box:

You can choose other events if needed, but for the simplicity of this post I’m just going to use this one. Click next. The Capture Global Fields page allows us to select what fields we want to capture. These are unique to each event selected. For this example, I’ll choose the following fields:
- Callstack
- Client_app_name
- Client_hostname
- Database_id
- Database_name
- Plan_handle
- Process_id
- Sql_text
- Transaction_id
- Transaction_sequence

Click next. On this page you can apply filters if needed. I’ll setup a filter so that I only capture data from the RollTide database. There are hundreds of different filters that can be configured so that you don’t pull back data that is not needed:

Click next to the Session Data Storage page. This page allows you to save data to a file or work with only the most recent data. I don’t want to keep thousands upon thousands of events so I’ll choose “Work with only the most recent data”

The next page summarizes all the options we have selected. You can also script this session if you need to create it on other servers or save it for later. Click Finish to create the new session.
The last page allows you to start the session immediately and watch live data. For this post, I’ll choose both:

You should see the new session under Extended Events and the Live Data tab should appear:


Once a deadlock occurs it should show the deadlock in the Live Data window:

This view shows all of the fields we selected including the XML report. If you click on the Deadlock tab, you’ll see the graph:

You can also use this query to see detailed information including the Deadlock graph and Event XML
SELECT
DATEADD(mi, DATEDIFF(mi, GETUTCDATE(), CURRENT_TIMESTAMP), DeadlockEventXML.value('(event/@timestamp)[1]', 'datetime2')) AS [EventTime],
DeadlockEventXML.value('(//process[@id[//victim-list/victimProcess[1]/@id]]/@hostname)[1]', 'nvarchar(max)') AS HostName,
DeadlockEventXML.value('(//process[@id[//victim-list/victimProcess[1]/@id]]/@clientapp)[1]', 'nvarchar(max)') AS ClientApp,
DB_NAME(DeadlockEventXML.value('(//process[@id[//victim-list/victimProcess[1]/@id]]/@currentdb)[1]', 'nvarchar(max)')) AS [DatabaseName],
DeadlockEventXML.value('(//process[@id[//victim-list/victimProcess[1]/@id]]/@transactionname)[1]', 'nvarchar(max)') AS VictimTransactionName,
DeadlockEventXML.value('(//process[@id[//victim-list/victimProcess[1]/@id]]/@isolationlevel)[1]', 'nvarchar(max)') AS IsolationLevel,
DeadlockEventXML.query('(event/data[@name="xml_report"]/value/deadlock)[1]') AS DeadLockGraph,
DeadlockEventXML
FROM
(
SELECT
XEvent.query('.') AS DeadlockEventXML,
Data.TargetData
FROM
(
SELECT
CAST(target_data AS XML) AS TargetData
FROM sys.dm_xe_session_targets st
JOIN sys.dm_xe_sessions s ON s.address = st.event_session_address
WHERE s.name = 'Deadlocks' AND
st.target_name = 'ring_buffer'
) AS Data
CROSS APPLY TargetData.nodes('RingBufferTarget/event[@name="xml_deadlock_report"]') AS XEventData(XEvent)
) AS DeadlockInfo