Collect SQL Server Performance Counters and Build Reports with SSRS

Third party tools are awesome for capturing performance metrics, but some small shops (and even large shops) don’t budget for this type of software leaving it up to the DBA to create their own monitoring solution.

There are a few different ways to capture certain performance metrics, but in this post I’ll focus on using the sys.dm_os_performance_counters DMV and how to view this data in a more readable form using SQL Server Reporting Services graphs. The DMV doesn’t include all the counters as Performance Monitor, but it does show the SQL Server related counters. (Note that some of the counters in this DMV are of cumulative values since the last reboot.)

You can query this DMV using the following query:

SELECT * FROM sys.dm_os_performance_counters
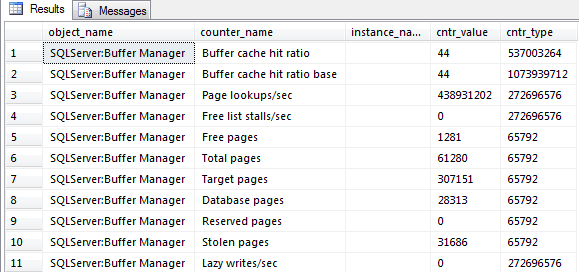
SQL Freelancer SQL Server Performance Counters SSRS

As you can see from the screenshot above, this can be hard to read. Also, it only shows the current values at the time the query is executed so you don’t know anything about the past and it makes it hard to see how the data fluctuates during the business day.

Collecting the SQL Server Monitoring Report Data

For the purpose of simplicity, this tip will focus on one counter, Page Life Expectancy (PLE). I’ll show you how to capture data and create a graph for analysis.

First, we’ll need to create a table that will store our metrics:

CREATE TABLE [dbo].[CounterCollections](
[ID] [int] IDENTITY(1,1) NOT NULL,
[object_name] [varchar](128) NOT NULL,
[counter_name] [varchar](128) NOT NULL,
[cntr_value] [bigint] NOT NULL,
[collection_datetime] [datetime] NOT NULL )

Next, we’ll need to create a script that will insert our data into the table we created above:

INSERT INTO CounterCollections
SELECT object_name, counter_name, cntr_value, GETDATE() collection_datetime
FROM sys.dm_os_performance_counters
WHERE object_name = ‘SQLServer:Buffer Manager’
AND counter_name = ‘Page life expectancy’

Finally, we’ll need to create a SQL Server Agent Job that will run the script above on a specified schedule:
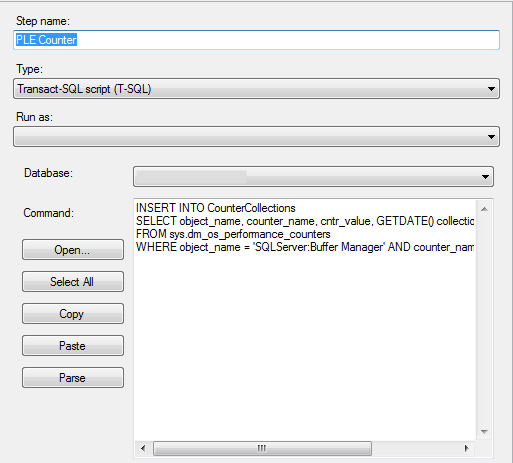
SQL Freelancer SQL Server Performance Counters SSRS
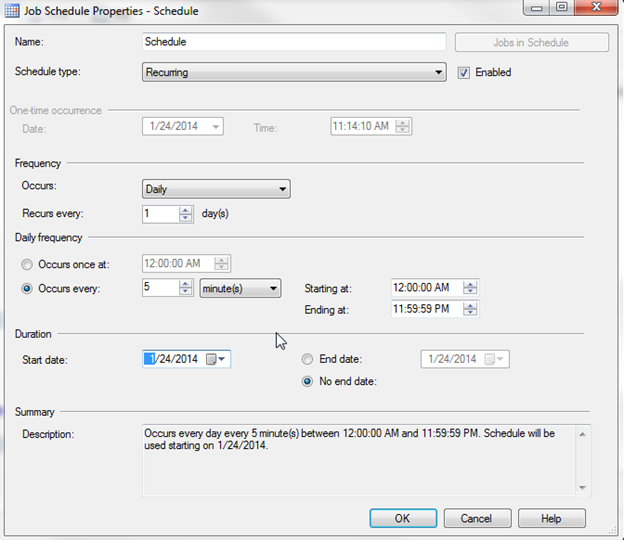
I’ll run this job every 5 minutes:

SQL Freelancer SQL Server Performance Counters SSRS

Creating the SQL Server Monitoring Report

While the table gathers data we can switch over to Business Intelligence Development Studio (BIDS) or the SQL Server Data Tools (SSDT) and create a SSRS Report that will display our data.

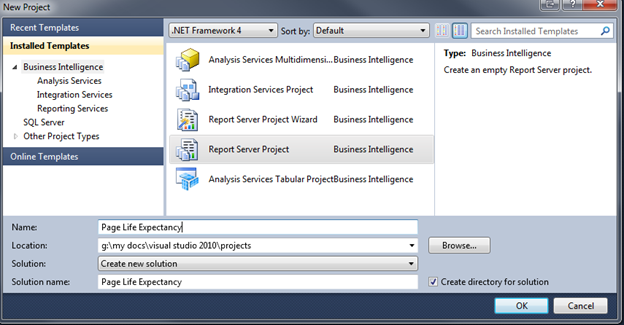
In this example, I’m using SSDT. Choose File, New Project. On the New Project dialog choose Report Server Project and name the Project:

SQL Freelancer SQL Server Performance Counters SSRS
Click here to view the rest of this post.

Creating a Table Warehouse to Retain Historical Data for a SQL Server Table

A lot of applications, including SCOM and even SSRS groom their databases so they don’t grow out of control. For instance, in SSRS there is a table called ExecutionLogStorage in the ReportServer database. This table holds details about report executions. SSRS grooms this table so that it only keeps a specified number of days of data. This is good for performance reasons obviously because the larger the table grows, the worse it will perform. However, what if you need to keep more days than specified? You can probably change the number of days in a config file but then the table will begin to grow and the server will not perform optimally. In cases like this, I like to create what I call a table warehouse. A table warehouse is basically a new table that stores data from another table, but doesn’t get groomed. A table warehouse will grow much larger than the source table, but the application doesn’t use this table so it shouldn’t effect performance, but it will effect disk space so make sure you plan accordingly. This is basically a data warehouse, but I like to think of a data warehouse as more than one table and I usually transform and massage the data before I move it to a data warehouse.

Some reasons why you might want to create a table warehouse include archiving data and reporting on older data that may get deleted in the future.

You can probably create this type of table several different ways but I like to use the UNION operator. In this post, I’ll show you the statement I use and we’ll walk through it.

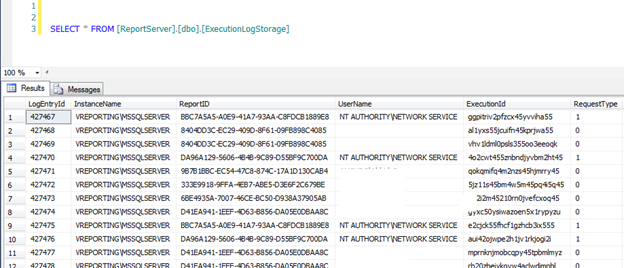
First, let’s look at the ExecutionLogStorage table:

SQL Freelancer SQL Server Table Warehouse

This table stores information such as InstanceName, UserName, Format, Parameters, Start/End Time, etc. By default, it only stores information for 60 days. Every night, SSRS grooms this table so that the 61st day of data is deleted. We need to keep more than 60 days of data so that’s where the table warehouse comes into play.

First thing we’ll need to do is create our table warehouse table that will hold the data. I don’t need all the columns from the ExecutionLogStorage table so I’ll just create my table warehouse to store InstanceName, UserName, Format, TimeStart, TimeEnd, TimeProcessing, Status, ByteCount and RowCount.

  CREATE TABLE [dbo].[ExecutionLogStorageTW](
 [InstanceName] [nvarchar](38) NOT NULL,
 [UserName] [nvarchar](260) NULL,
 [Format] [nvarchar](26) NULL,
 [TimeStart] [datetime] NOT NULL,
 [TimeEnd] [datetime] NOT NULL,
 [TimeProcessing] [int] NOT NULL,
 [Status] [nvarchar](40) NOT NULL,
 [ByteCount] [bigint] NOT NULL,
 [RowCount] [bigint] NOT NULL
    )

Next we can use the following query to see the differences between the ExecutionLogStorage table and our new ExecutionLogStorageTW table:

SELECT MIN(TableName) AS TableName
 ,InstanceName
 ,UserName
 ,[Format]
 ,TimeStart
 ,TimeEnd
 ,TimeProcessing
 ,[Status]
 ,ByteCount
 ,[RowCount]
FROM (
 SELECT 'ELS' AS TableName
  ,els.InstanceName
  ,els.UserName
  ,els.[Format]
  ,els.TimeStart
  ,els.TimeEnd
  ,els.TimeProcessing
  ,els.[Status]
  ,els.ByteCount
  ,els.[RowCount]
 FROM [ReportServer].[dbo].[ExecutionLogStorage] els

 UNION ALL

 SELECT 'ELSDW' AS TableName
  ,elstw.InstanceName
  ,elstw.UserName
  ,elstw.[Format]
  ,elstw.TimeStart
  ,elstw.TimeEnd
  ,elstw.TimeProcessing
  ,elstw.[Status]
  ,elstw.ByteCount
  ,elstw.[RowCount]
 FROM [ReportServer].[dbo].[ExecutionLogStorageTW] elstw
 ) tmp
GROUP BY InstanceName
 ,UserName
 ,[Format]
 ,TimeStart
 ,TimeEnd
 ,TimeProcessing
 ,[Status]
 ,ByteCount
 ,[RowCount]
HAVING COUNT(*) = 1

This query will UNION all the results from ExecutionLogStorage and ExecutionLogStorageTW and display the data that is different. As you can see from the results below there are 72325 results that are different. The TableName column displays the table that the data resides in, therefore you can see that all the data resides in the ELS (ExecutionLogStorage) table.

Since ExecutionLogStorageTW is empty it should show the exact results as:

SELECT * FROM [ReportServer].[dbo].[ExecutionLogStorage]

Click here to view the rest of this post

SQL Server Index Properties in Management Studio

Understanding indexes and how they work can be complicated enough for a Jr. DBA, but throw in all the different options and properties and an index can soon be overwhelming. In this post, I’ll discuss the different options available when creating a basic index.

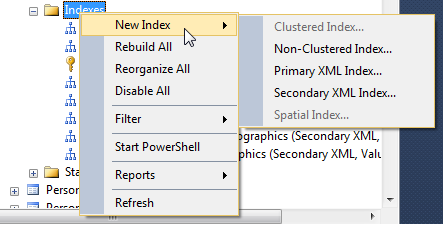
To create an index using SSMS, expand the tree for a table and right click on Indexes and select New Index: (This tip will not discuss the anatomy of an index, but will focus on the properties.)

SQL Freelancer SQL Server Index Properties

After choosing the index type, you will notice that there a few tabs on the left side that will define how your index will act. These tabs will differ between SSMS versions but basically have the same information. In this tip, we’ll be using SQL Server 2012 SSMS.

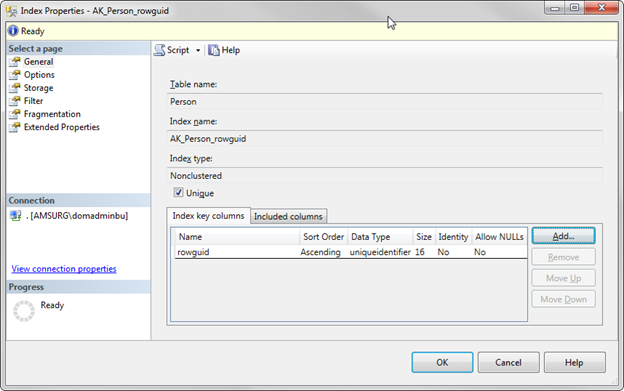
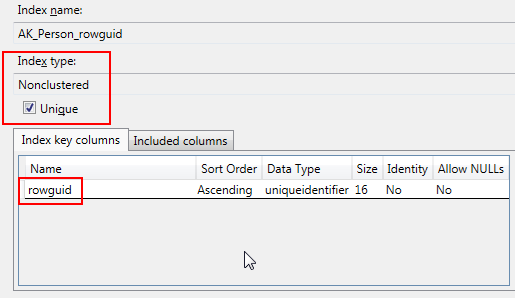
The first tab, General, is where you can set the index name, the key columns, and the included columns (if any). This tab also shows the table name and index type you selected:

SQL Freelancer SQL Server Index Properties
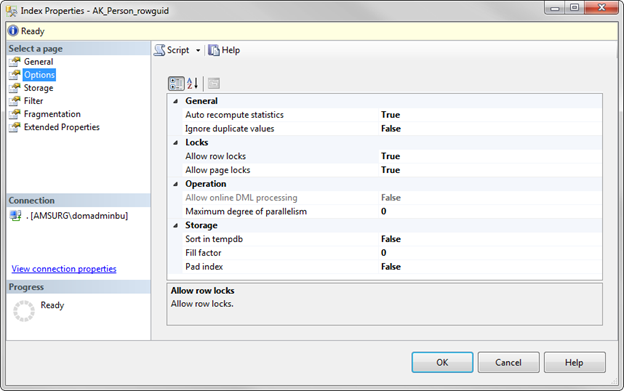
The next tab, Options, is where you can view or modify the properties for the index:

SQL Freelancer SQL Server Index Properties

Let’s go over each property.

Index Properties Options Page

We will begin with the options page.

Auto recompute statistics

This property defines whether or not you want SQL Server to automatically update the index statistics. Best practice is to leave this option set to True, otherwise you will have to manually update the statistics.

According to Microsoft, statistics are considered outdated when the following happens:

  • The table size has gone from 0 to >0 rows.
  • The number of rows in the table when the statistics were gathered was 500 or less, and the column modification counters (colmodctr) of the leading column of the statistics object has changed by more than 500 since then.
  • The table had more than 500 rows when the statistics were gathered, and the colmodctr of the leading column of the statistics object has changed by more than 500 + 20% of the number of rows in the table when the statistics were gathered.

Outdated statistics can lead to performance problems.

As the link above states, the statistics auto update is triggered by query optimization or by execution of a complied plan, and it involves only a subset of the columns referred to in the query.

Ignore duplicate values

This property specifies where a duplicate key value can be inserted into the column that is part the index. If set to “True”, SQL Server will issue a warning when an INSERT statement is about to create a duplicate key and will ignore the duplicate row. If this option is set to “False”, SQL Server will issue an error message and rolls back the INSERT statement.

Example:

In this example (AdventureWorks2012.Person.Person), I have a Non-clustered, unique index. My key column is rowguid.

SQL Freelancer SQL Server Index Properties
I’ve set the Ignore duplicate values to “False”

SQL Freelancer SQL Server Index Properties

If I try to INSERT a duplicate value for rowguid, I get the following error:

Msg 2601, Level 14, State 1, Line 1 Cannot insert duplicate key row in object ‘Person.Person’ with unique index ‘AK_Person_rowguid’. The duplicate key value is (92c4279f-1207-48a3-8448-4636514eb7e2). The statement has been terminated.

If I change the Ignore duplicate values to “True” and try to INSERT a duplicate value for rowguid I get the following:

(0 row(s) affected)

As you can see, neither of these inserted the duplicate value because it was a UNIQUE index but one returned an error message and ended the statement while the other didn’t return an error. If I was inserting multiple records the first message would have rolled back the transaction while the second message would have inserted all the unique values and skipped over the unique record.

The default value for this option is “False” and can only be used on UNIQUE indexes.

Click here to view the rest of this post.

SQL Server Integration Services Data Type Conversion Testing

There are two ways of converting data types within SQL Server Integration Services (SSIS).  Here is an overview of those options:

  • One way is using T-SQL code. Using the CAST function in your code can convert one data type into another. The scope of this tip is not intended on going into detail about the CAST function, but I will show a quick example.
  • The second way is using the Data Conversion Transformation Task. This task will convert the data in an input column to a different data type and then copy it to the output column. The task itself isn’t too complicating to setup as I’ll show you in this tip.

SQL Server Integration Services Data Conversion Task to Convert Data Types

Let’s look at the Data Conversion task first…

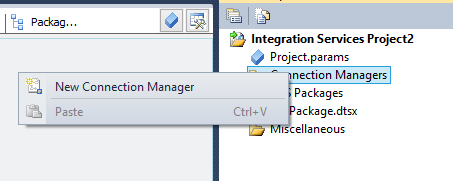
First, open Visual Studio (or Business Intelligence Dev Studio if you’re using pre SQL Server 2012) and create an SSIS project. Next, we can go ahead and configure a Connection Manager to our database. Right click Connection Managers in Solution Explorer and choose New Connection Manager:

SQL Freelancer SQL Server SSIS Data Type Conversion
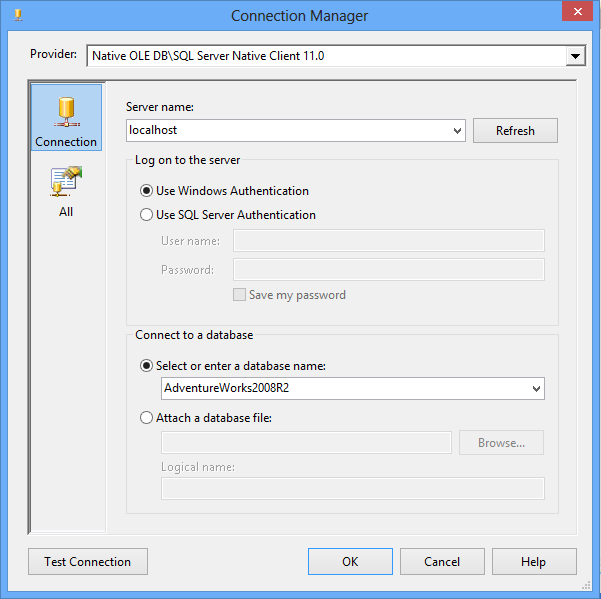
Choose your Connection Manager type. In this example, we’ll use OLEDB. Next, configure the Connection Manager to point to your dataset. In this example, I’ll use localhost and the AdventureWorks2008R2 database:
SQL Freelancer SQL Server SSIS Data Type Conversion
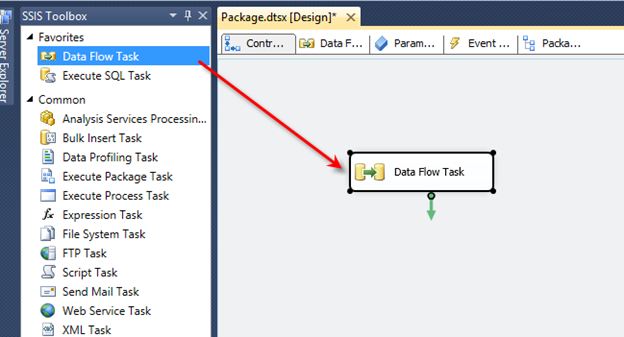
Test the connection and click OK. Next, drag a Data Flow task from the SSIS toolbox onto the design screen:

SQL Freelancer SQL Server SSIS Data Type Conversion
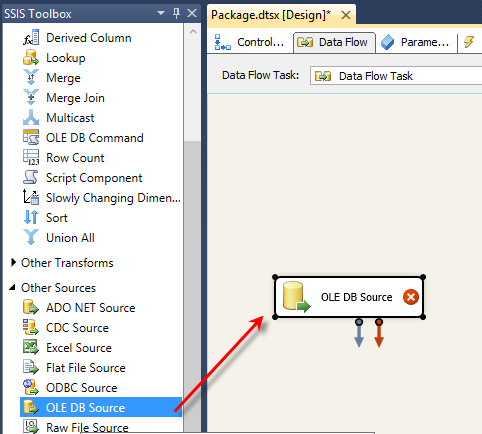
Right click the Data Flow task and choose Edit. You are now inside the data flow task. This is where all the action happens. Drag an OLEDB source task from the SSIS toolbox to the design screen:

SQL Freelancer SQL Server SSIS Data Type Conversion
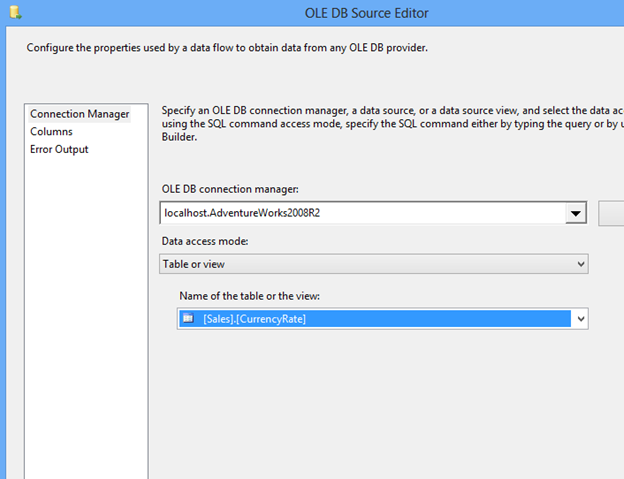
Right click the OLEDB task and choose Edit. This screen is where we will define the Connection Manager we created earlier. Under OLEDB connection manager choose the connection you created. Leave data access mode as Table or view. Change the name of the table or the view to the table that contains the data types to change. In this example, I’ll use a table named Sales.CurrencyRate:

SQL Freelancer SQL Server SSIS Data Type Conversion
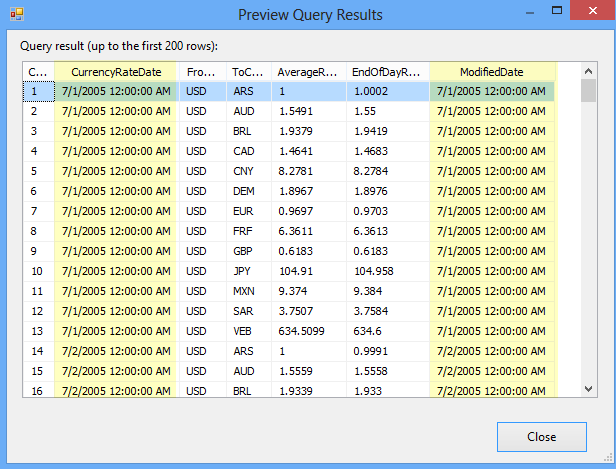
To preview the data click Preview. In my example, I want to change the CurrencyRateDate and the ModifiedDate columns from a datetime data type to a date data type:

SQL Freelancer SQL Server SSIS Data Type Conversion
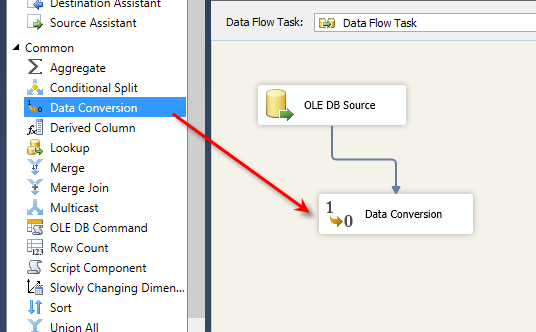
Click OK to close the OLEDB Source task. Drag the Data Conversion Transformation task onto the design screen. Connect the OLEDB Source task to the Data Conversion task:

SQL Freelancer SQL Server SSIS Data Type Conversion
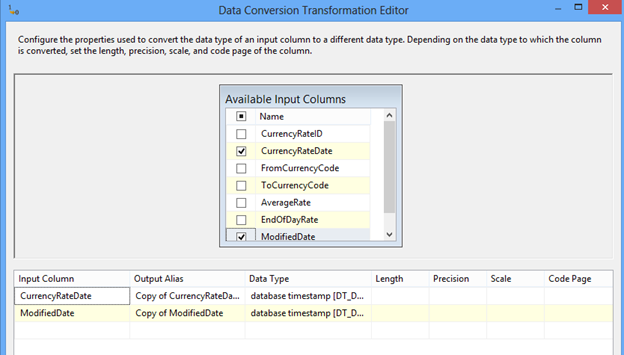
Right click the Data Conversion task and choose Edit. Here is where we will convert our data types. Since I am converting CurrencyRateDate and ModifiedDate I will click on each of them in the Available Input Columns list:

SQL Freelancer SQL Server SSIS Data Type Conversion

Click here to view the rest of this post.


Fixing SQL Server error in-row data RSVD page count is incorrect

I ran DBCC CHECKDB (Integrity Checks) in my maintenance plan and I also ran it manually, but I keep getting the error “The In-row data RSVD page count for object “table_name” , index ID 0, partition ID 58037252456448, alloc unit ID 58037252456448 (type In-row data) is incorrect.” How can I fix this error?

Solution

Before we discuss the simple steps to fixing this error, let’s discuss what might have happened in this situation.

Anytime you see an integrity check error it might make you a little queasy. No need to worry on this error. If you have recently upgraded from SQL Server 2000 then this error is somewhat common. I know what you’re saying, “Why is there a tip regarding SQL Server 2000?” Trust me, a lot of people are still running SQL Server 2000 which is now out of compliance with Microsoft, so everyone is in a rush to upgrade. Anyway, SQL Server 2000 used to update the page space used metadata. Once SQL Server 2005 came along, this was no longer the case so if you didn’t run DBCC UPDATEUSAGE after the upgrade/migration this error is likely to appear when you run DBCC CHECKDB.

Here is what the error message looks like:

Msg 2508, Level 16, State 3, Line 1

The In-row data RSVD page count for object "table_name", index ID 0, partition ID 58037252456448,
alloc unit ID 58037252456448 (type In-row data) is incorrect. Run DBCC UPDATEUSAGE.

Running DBCC UPDATEUSAGE

If you notice in the maintenance plan or the DBCC CHECKDB results above, it displays “Run DBCC UPDATEUSAGE” after the error message. Ta da! After backing up your databases and establishing a maintenance window run DBCC UPDATEUSAGE (databasename). In a perfect world, SQL would notice this error and run DBCC UPDATEUSAGE on the appropriate table. This is not a perfect world, so we have to run it manually.

DBCC UPDATEUSAGE reports and corrects pages and row count inaccuracies in the catalog views. These inaccuracies may cause incorrect space usage reports returned by the sp_spaceused system stored procedure – MSDN.

 DBCC UPDATEUSAGE (Apollo32_Fixed)

After running DBCC UPDATEUSAGE (databasename) on my questionable database you can see that all the page counts have been updated:


DBCC UPDATEUSAGE: Usage counts updated for table 'UserList' (index 'UserList', partition 1):
        USED pages (In-row Data): changed from (5) to (4) pages.
DBCC UPDATEUSAGE: Usage counts updated for table 'UserRights' (index 'UserRights', partition 1):
        USED pages (In-row Data): changed from (72) to (24) pages.
        RSVD pages (In-row Data): changed from (80) to (33) pages.
DBCC UPDATEUSAGE: Usage counts updated for table 'UserRights' (index 'UserRights', partition 1):
        USED pages (In-row Data): changed from (5) to (4) pages.
DBCC UPDATEUSAGE: Usage counts updated for table 'UserGroups' (index 'UserGroups', partition 1):
        USED pages (In-row Data): changed from (4) to (3) pages.
DBCC UPDATEUSAGE: Usage counts updated for table 'Application' (index 'Application', partition 1):
        USED pages (In-row Data): changed from (3) to (2) pages.
        

You only need to run DBCC UPDATEUSAGE once. After the page counts have been corrected your SQL Server will be back to normal. If you do not fix this issue right away, page counts will continue to get worse when data is added and will result in abnormalities in space usage reports.

After the update, running DBCC CHECKDB gives me a clean database again:

CHECKDB found 0 allocation errors and 0 consistency errors in database ”database_name’. DBCC execution completed. If DBCC printed error messages, contact your system administrator.

In essence, DBCC UPDATEUSAGE updates the used, reserved, and rows columns of the sysindexes (later named sys.indexes in SQL Server 2005) table.

In this example I have two databases named Apollo32 and Apollo32_Fixed. When running an integrity check against Apollo32 I get the error described above. Apollo32_Fixed is a copy of Apollo32 after running DBCC UPDATEUSAGE.

Before and After Comparison

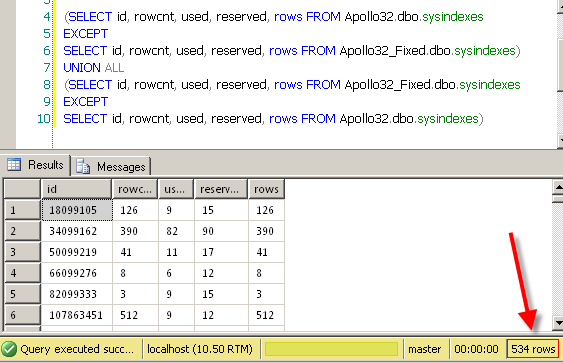
If I compare Apollo32.dbo.sysindexes to Apollo32_Fixed.dbo.sysindexes I can see I have 534 differences.

 (SELECT id, rowcnt, used, reserved, rows FROM Apollo32.dbo.sysindexes
EXCEPT
SELECT id, rowcnt, used, reserved, rows FROM Apollo32_Fixed.dbo.sysindexes)
UNION ALL
(SELECT id, rowcnt, used, reserved, rows FROM Apollo32_Fixed.dbo.sysindexes
EXCEPT
SELECT id, rowcnt, used, reserved, rows FROM Apollo32.dbo.sysindexes)

SQL Freelancer SQL Server RSVD fix
Click here to view the rest of this post.

Identify and Correct SQL Server Forwarded Records

Forwarded records in SQL Server can cause performance issues on heap tables because the record outgrows the page and the database engine uses pointers to reference the data. For those that don’t know what a heap is, it is a table without a clustered index. The best practice is to have a clustered index on every table, however, sometimes there are cases when a clustered index is not needed. In this case, DBA’s should be aware of all heap tables and should be concerned about forwarded records causing poor performance.  In this post, I’ll discuss forwarded records and how fix them.

Forwarded records are records in a SQL Server table that have grown too large for the page that it currently resides on.  These types of records can only be found in heaps because tables with a clustered index keep the data sorted based on the clustered index.  With a heap, once the record outgrows the page, the record is moved to a new page and a forwarding pointer is left in the original location to point to the new location.

Let’s look at an example of a forwarding record.

First, let’s create a table and insert some records:

CREATE TABLE [dbo].[Demo](
 [ID] [int] IDENTITY(1,1),
 [Server] [nvarchar](50) NULL,
 [DatabaseName] [nvarchar](100) NULL,
 [timestamp] [datetime] default getdate())
GO 
    CREATE INDEX idx_Server ON Demo(Server)
GO
    INSERT INTO Demo
    (Server,DatabaseName)
    VALUES  ('Server1', 'DB1') 
    INSERT INTO Demo
    (Server,DatabaseName)
    VALUES  ('Server2', 'DB2')
    INSERT INTO Demo
    (Server,DatabaseName)
    VALUES  ('Server3', 'DB3')
GO 100

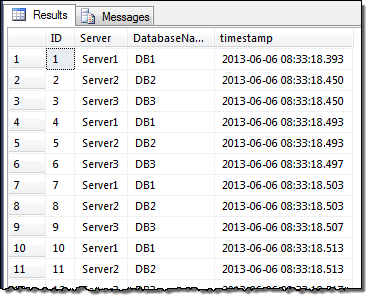
SQL Freelancer SQL Server Forwarded Records
Next, let’s use the following DMV query to check our table:

SELECT
    OBJECT_NAME(ps.object_id) as TableName,
    i.name as IndexName,
    ps.index_type_desc,
    ps.page_count,
    ps.avg_fragmentation_in_percent,
    ps.forwarded_record_count
FROM sys.dm_db_index_physical_stats (DB_ID(), NULL, NULL, NULL, 'DETAILED') AS ps
INNER JOIN sys.indexes AS i
    ON ps.OBJECT_ID = i.OBJECT_ID  
    AND ps.index_id = i.index_id
WHERE OBJECT_NAME(ps.object_id) = 'Demo'

SQL Freelancer SQL Server Forwarded Records

Notice that the HEAP index type has 0 forwarded records.

Next we will change the table definition by modifying the DatabaseName column.

ALTER TABLE Demo ALTER COLUMN [DatabaseName] nvarchar(MAX)

If we run the DMV query again you will see that the forwarded_record_count has changed (along with a lot of fragmentation):

SQL Freelancer SQL Server Forwarded Records

The page count increased to 3 on the HEAP indicating that a new page was created and 50 forwarded records were created.

In a real world situation you will probably not know exactly when this happens so by changing the WHERE clause in the DMV query you can find all the forwarded records in a database. I would monitor heap tables at least monthly and if you notice high I/O on a heap, then that should be a hint that something needs to be looked at and possibly modified.

SELECT
    OBJECT_NAME(ps.object_id) as TableName,
    i.name as IndexName,
    ps.index_type_desc,
    ps.page_count,
    ps.avg_fragmentation_in_percent,
    ps.forwarded_record_count
FROM sys.dm_db_index_physical_stats (DB_ID(), NULL, NULL, NULL, 'DETAILED') AS ps
INNER JOIN sys.indexes AS i
    ON ps.OBJECT_ID = i.OBJECT_ID  
    AND ps.index_id = i.index_id
WHERE forwarded_record_count > 0

On my Test DB, you will notice I have two HEAP tables that have forwarded records including the one I just created.

SQL Freelancer SQL Server Forwarded Records
Click here to view the rest of this post.

SQL Server Simple and Forced Parameterization

There are two different parameterization options that one can use in SQL Server. Simple parameterization and Forced parameterization. Let’s discuss each a little more in detail.

Simple Parameterization

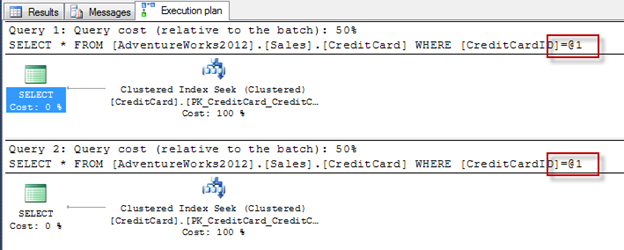
When you execute a SQL statement without parameters, SQL Server internally will add parameters where needed so that it can try to reuse a cached execution plan. For example, if you look at the execution plan of the following statement you will see that SQL Server changes the WHERE value to a parameter (@1):

SELECT * FROM AdventureWorks2012.Sales.CreditCard WHERE CreditCardID = 11

SQL Freelancer SQL Server Parameterization

SQL Server builds this execution plan as if a parameter was the input instead of the number 11. Because of this parameterization, the following two statements show an example of SQL Server reusing the same execution plan even though the data results are different:

SELECT * FROM AdventureWorks2012.Sales.CreditCard WHERE CreditCardID = 11
SELECT * FROM AdventureWorks2012.Sales.CreditCard WHERE CreditCardID = 207

SQL Freelancer SQL Server Parameterization

This is the default behavior for Simple parameterization, however, it only applies to a small class of queries. If you want all your queries parameterized, you will need to enable the option, Forced parameterization.

Forced Parameterization

Forced parameterization is when the database engine parameterizes any literal value that appears in a SELECT, UPDATE, INSERT, or DELETE statement submitted in any form, but there are a few exceptions.  Refer to this article for a list of these exceptions.

Some applications use queries that pass in literals as opposed to stored procedures that pass in parameters. For these type of applications you may want to experiment with enabling Forced parameterization to see if it has a positive effect on the workload by reducing query compilations.

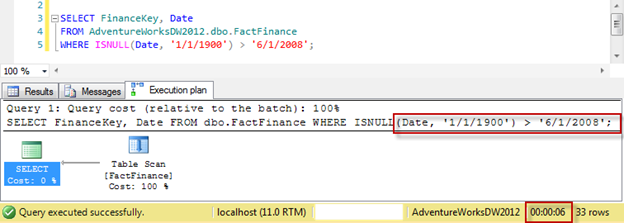
Running the following query in Simple parameterization produces the following execution plan where the WHERE clause is not parameterized:

SQL Freelancer SQL Server Parameterization
Click here to view the rest of this post.

Detecting CPU Pressure

There are a few different ways to detect CPU pressure, for example, Performance Monitor or SQL Profiler, but in this tip we’ll discuss the wait type SOS_SCHEDULER_YIELD and the DMV sys.dm_os_schedulers.

Some of you might have seen the wait type SOS_SCHEDULER_YIELD and wondered what in the world is this? Books Online (BOL) describes this wait type as:

Occurs when a task voluntarily yields the scheduler for other tasks to execute. During this wait the task is waiting for its quantum to be renewed.

SOS_SCHEDULER_YIELD is a fairly common wait type and occurs when there is CPU pressure. SQL Server runs multiple threads and tries to allow all threads to run without problems. However, if all the threads are busy on each scheduler and can’t let other threads run, it will yield itself for another thread, which in turn creates the SOS_SCHEDULER_YIELD wait type.

You can see the top wait stats and the percentage of waits at the current point in time by running the following query by Tim Ford and Glenn Berry.

WITH Waits AS 
( 
SELECT 
wait_type, 
wait_time_ms / 1000. AS wait_time_s, 
100. * wait_time_ms / SUM(wait_time_ms) OVER() AS pct, 
ROW_NUMBER() OVER(ORDER BY wait_time_ms DESC) AS rn 
FROM sys.dm_os_wait_stats 
WHERE wait_type 
NOT IN 
('CLR_SEMAPHORE', 'LAZYWRITER_SLEEP', 'RESOURCE_QUEUE', 
'SLEEP_TASK', 'SLEEP_SYSTEMTASK', 'SQLTRACE_BUFFER_FLUSH', 'WAITFOR', 
'CLR_AUTO_EVENT', 'CLR_MANUAL_EVENT') 
) -- filter out additional irrelevant waits 
SELECT W1.wait_type, 
CAST(W1.wait_time_s AS DECIMAL(12, 2)) AS wait_time_s, 
CAST(W1.pct AS DECIMAL(12, 2)) AS pct, 
CAST(SUM(W2.pct) AS DECIMAL(12, 2)) AS running_pct 
FROM Waits AS W1 
INNER JOIN Waits AS W2 ON W2.rn <= W1.rn 
GROUP BY W1.rn, 
W1.wait_type, 
W1.wait_time_s, 
W1.pct 
HAVING SUM(W2.pct) - W1.pct < 95; -- percentage threshold;

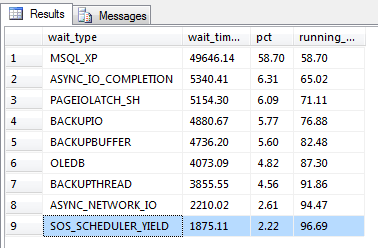
After running this query on one of my servers I can see that only 2.22% of my waits are due to CPU pressure so I can rule that out as a cause for poor performance. (This is only current since the last SQL Service restart):

SQL Freelancer SQL Server CPU Pressure DMV

If you see a high percentage of this wait type then one way of troubleshooting this is to use the DMV sys.dm_os_schedulers. BOL describes sys.dm_os_schedulers as:

Returns one row per scheduler in SQL Server where each scheduler is mapped to an individual processor. Use this view to monitor the condition of a scheduler or to identify runaway tasks.

This DMV has several columns including number or workers, active tasks, and the status of each scheduler, etc., which can help troubleshoot certain problems, but the most important column is the one used for measuring queued tasks, the runnable_tasks_count column. This column displays the count of tasks yielding to other tasks resulting in a SOS_SCHEDULER_YIELD wait type. If this column is frequently greater than 0 then CPU pressure may be present and blocking may occur.

To see an average of current tasks and current waiting tasks you can use the following query:

SELECT AVG(current_tasks_count) AS [Avg Current Task], 
AVG(runnable_tasks_count) AS [Avg Wait Task]
FROM sys.dm_os_schedulers
WHERE scheduler_id < 255
AND status = 'VISIBLE ONLINE'

SQL Freelancer SQL Server CPU Pressure DMV
Click here to view the rest of this post.

Report to Capture Table Growth Statistics for SQL Server

There are a few tools that monitor table size growth, but with the use of sp_spaceused and SQL Server Reporting Services (SSRS) you can make custom reports.

Using sp_spaceused

The system stored procedure sp_spaceused displays the number of rows, disk space reserved, and disk space used by a table, indexed view, or Service Broker queue in the current database in an object is provided or it displays the disk space reserved and used by the whole database.

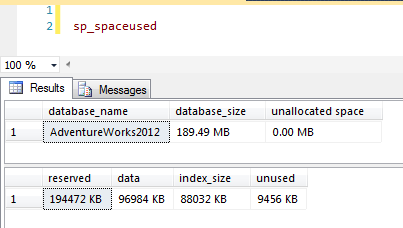
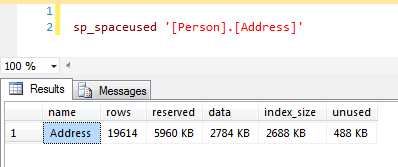
This procedure, sp_spaceused can be used at the database or table level. For example, sp_spaceused at the database level returns the following:

SQL Freelancer SQL Server SSRS Table Growth
And sp_spaceused at the table level displays:
SQL Freelancer SQL Server SSRS Table Growth


Creating the Report

To create our custom report, first we will need to create a table that will store the data from sp_spaceused. For this example, I’ll create a table named TableSizeGrowth.

CREATE TABLE [dbo].[TableSizeGrowth](
[id] [int] IDENTITY(1,1) NOT NULL,
[table_schema] [nvarchar](256) NULL,
[table_name] [nvarchar](256) NULL,
[table_rows] [int] NULL,
[reserved_space] [int] NULL,
[data_space] [int] NULL,
[index_space] [int] NULL,
[unused_space] [int] NULL,
[date] [datetime] NULL
) ON [PRIMARY]

I’m also going to add a default constraint that will automatically update the date column to the current date for each new row.

ALTER TABLE [dbo].[TableSizeGrowth] ADD CONSTRAINT [DF_TableSizeGrowth_date]  
DEFAULT (dateadd(day,(0),datediff(day,(0),getdate()))) FOR [date]
GO

Next, we need to create a stored procedure that moves the data from sp_spaceused to the table we created above. I have put comments throughout the stored procedure to help you figure out what is going on. Also make sure you change the table names to match your tables. For this example, I want to monitor HumanResources.Employee, Production.Product, and Purchasing.Vendor tables.

SET ANSI_NULLS ON
GO
SET QUOTED_IDENTIFIER ON
GO
CREATE PROCEDURE [dbo].[sp_TableSizeGrowth] 
AS
BEGIN
 SET NOCOUNT ON

 --DECLARE VARIABLES
 DECLARE
 @max INT,
 @min INT,
 @table_name NVARCHAR(256),
 @table_schema NVARCHAR(256),
 @sql NVARCHAR(4000)

 --DECLARE TABLE VARIABLE
 DECLARE @table TABLE(
 id INT IDENTITY(1,1) PRIMARY KEY,
 table_name NVARCHAR(256),
 table_schema NVARCHAR(256))

 --CREATE TEMP TABLE THAT STORES INFORMATION FROM SP_SPACEUSED
 IF (SELECT OBJECT_ID('tempdb..#results')) IS NOT NULL
 BEGIN
  DROP TABLE #results
 END

 CREATE TABLE #results
 (
  [table_schema] [nvarchar](256) NULL,
  [table_name] [nvarchar](256) NULL,
  [table_rows] [int] NULL,
  [reserved_space] [nvarchar](55) NULL,
  [data_space] [nvarchar](55) NULL,
  [index_space] [nvarchar](55) NULL,
  [unused_space] [nvarchar](55) NULL
 )

 --LOOP THROUGH STATISTICS FOR EACH TABLE
 INSERT @table(table_schema, table_name)
 SELECT  
  table_schema, table_name
 FROM
  information_schema.tables 
 WHERE table_schema + '.' + table_name IN ('HumanResources.Employee','Production.Product', 'Purchasing.Vendor') --INSERT TABLE NAMES TO MONITOR

 SELECT
  @min = 1,
  @max = (SELECT MAX(id) FROM @table)

 WHILE @min = @max
 BEGIN
  SELECT 
   @table_name = table_name,
   @table_schema = table_schema
  FROM
   @table
  WHERE
   id = @min

  --DYNAMIC SQL
  SELECT @sql = 'EXEC sp_spaceused ''[' + @table_schema + '].[' + @table_name + ']'''

  --INSERT RESULTS FROM SP_SPACEUSED TO TEMP TABLE
  INSERT #results(table_name, table_rows, reserved_space, data_space, index_space, unused_space)
  EXEC (@sql)

  --UPDATE SCHEMA NAME
  UPDATE #results
  SET table_schema = @table_schema
  WHERE table_name = @table_name
  SELECT @min = @min + 1
 END

 --REMOVE "KB" FROM RESULTS FOR REPORTING (GRAPH) PURPOSES
 UPDATE #results SET data_space = SUBSTRING(data_space, 1, (LEN(data_space)-3))
 UPDATE #results SET reserved_space = SUBSTRING(reserved_space, 1, (LEN(reserved_space)-3))
 UPDATE #results SET index_space = SUBSTRING(index_space, 1, (LEN(index_space)-3))
 UPDATE #results SET unused_space = SUBSTRING(unused_space, 1, (LEN(unused_space)-3))

 --INSERT RESULTS INTO TABLESIZEGROWTH
 INSERT INTO TableSizeGrowth (table_schema, table_name, table_rows, reserved_space, data_space, index_space, unused_space)
 SELECT * FROM #results

 DROP TABLE #results
END

Now that the stored procedure has been created, let’s go ahead and execute it.

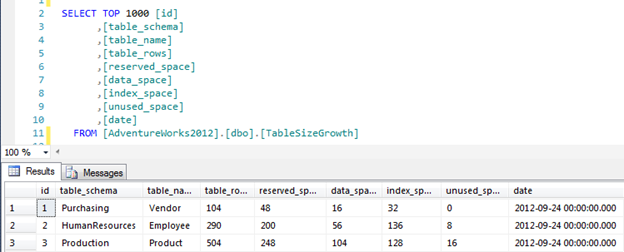
Once the stored procedure finishes we can view the table:

SQL Freelancer SQL Server SSRS Table Growth
Click here to view the rest of this post.

Client Statistics

A feature often overlooked while tuning queries is Client Statistics located right on SSMS editor bar.

SQL Freelancer SQL Server Client Statistics
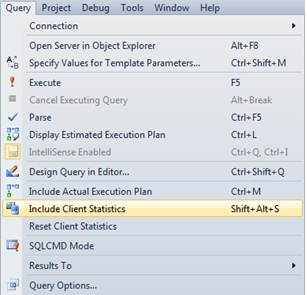
Other ways of opening Client Statistics include:

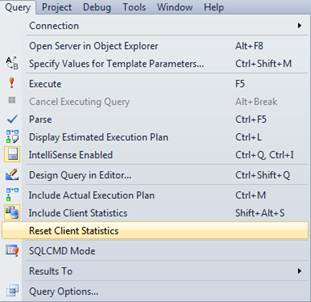
SHIFT + ALT + S and Menu Bar – Query -> Include Client Statistics

SQL Freelancer SQL Server Client Statistics

Client Statistics is useful when the user needs to gather information about execution times, processing times, the amount of data sent between client and server, etc. it’s very easy to use. Simply turn it on using one of the methods above and execute your query.

In this example I’m using the following query:

SELECT pc.FirstName
,pc.LastName
,pc.EmailAddress
,he.Title
,hh.Rate
FROM Person.Contact pc
JOIN HumanResources.Employee he ON pc.ContactID = he.ContactID
JOIN HumanResources.EmployeePayHistory hh ON he.EmployeeID = hh.EmployeeID
WHERE hh.Rate > 10
ORDER BY hh.Rate

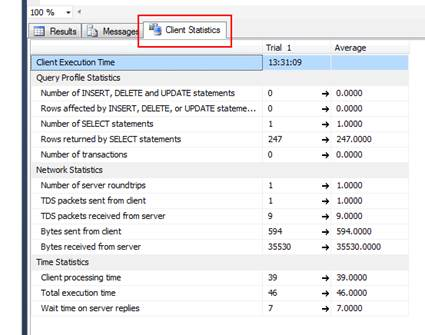
After executing the query you will notice a new tab labeled Client Statistics:

SQL Freelancer SQL Server Client Statistics

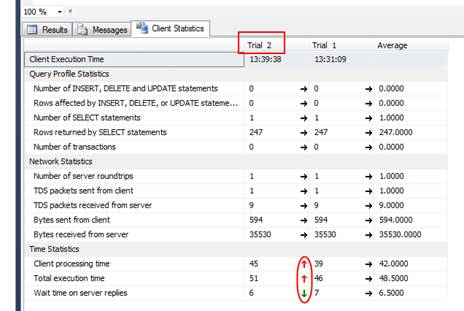
After looking at the statistics provided for Trial 1 you can see the processing time = 39ms, execution time = 46ms, etc.

After the running the same query again I get the following results under Trial 2:

SQL Freelancer SQL Server Client Statistics
This time processing time went up to 45ms and execution time went up to 51ms. It also has an average column to compare overall results. The green and red arrows represent differences between trials. Green arrows indicate improved statistics and red arrows indicate degrading statistics.

A max of 10 trials can be run with the 11th trial dropping the 1st trial and so on. To reset statistics, on the menu bar, go to Query, Reset Client Statistics.

SQL Freelancer SQL Server Client StatisticsThis is great when tuning indexes because you can see different statistics as you add/delete indexes.